
Fig. 1.
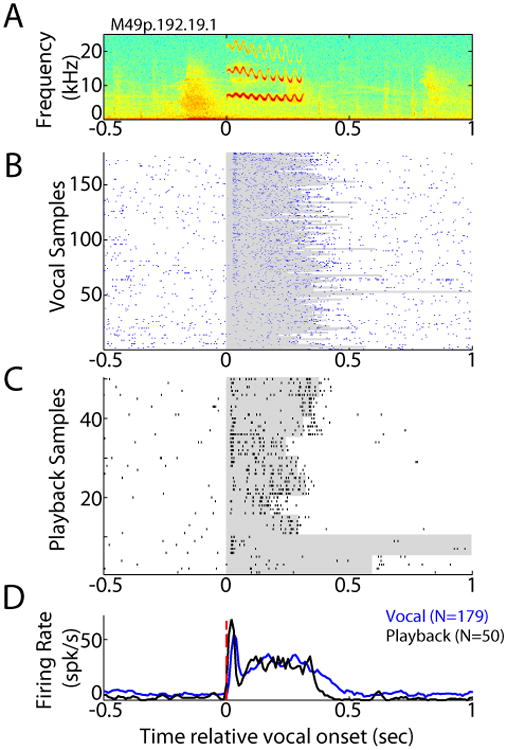
Sample unit with excitatory responses during both vocal production and playback. A: Spectrogram of sample trill vocalization. B: Raster plot of unit response to produced trill vocalizations, aligned by vocal onset. Shaded: duration of vocalization. C: Raster plot of unit response to playback of trills, including phase locking to vocal oscillations for some samples. D: Peri-stimulus time histograms (PSTHs) for trill vocalization production (blue) and playback (black) aligned by vocal onset. This unit showed similar response to both production and playback, including onset and sustained responses.