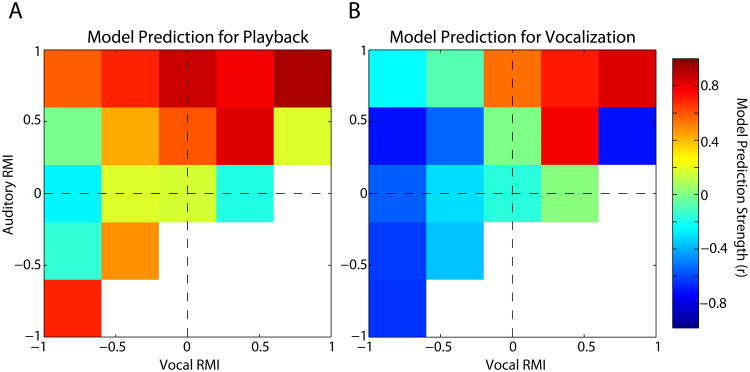
Fig. 10.
Comparison of model prediction accuracy with vocalization and playback responses. Model predictions of unit mean responses were grouped by unit vocal and auditory RMIs and the prediction accuracy for each group measured by a correlation coefficient. Two-dimensional plots of the accuracy are shown separately for predictions of vocal playback (A) and production (B) responses. Colorbar (right) indicates the correlation scale. Predications were better for playback than vocalization. Predictions were also stronger for units excited by playback and/or vocal production, and weaker for vocalization-suppressed units.

