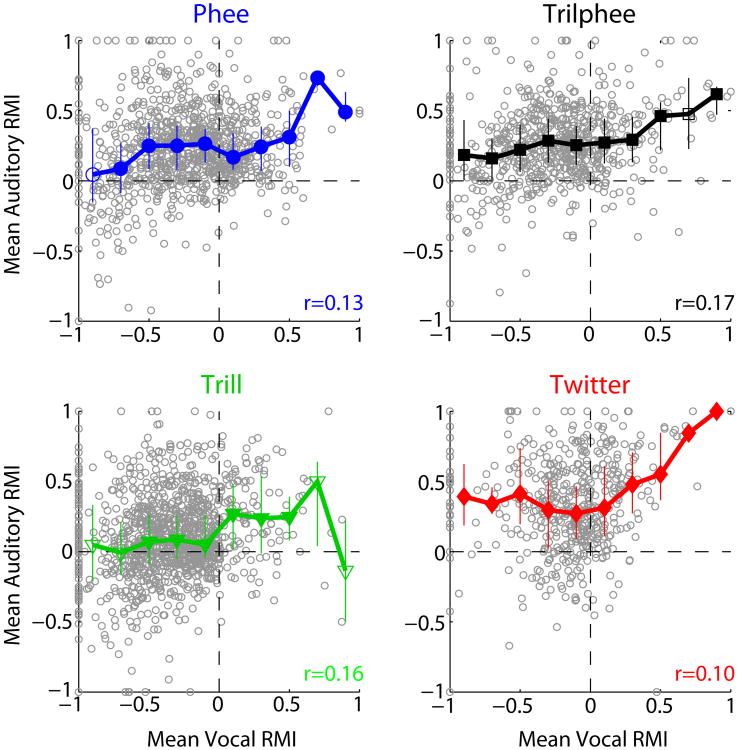
Fig. 3.
Population comparison of vocalization and playback responses. Vocalization (“Vocal RMI”) and playback (“Auditory RMI”) responses were quantified by a normalized RMI measure and averaged for each unit. Comparisons are plotted individually for the four most common marmoset vocalization classes: phee (blue, top left), trillphee (black, top right), trill (green, bottom left), and twitter (red, bottom right). Plotted curves indicate mean auditory RMI for units binned by their vocal RMI. Vocal RMIs <0 indicate suppression during vocalization, and RMIs>0 indicate excitation. Auditory responses were distributed around zero for suppressed units and increased with vocal responses. Error bars: bootstrapped 95% confidence intervals. Filled symbols: statistically significant deviations from 0 (p<0.01. signed-rank).

