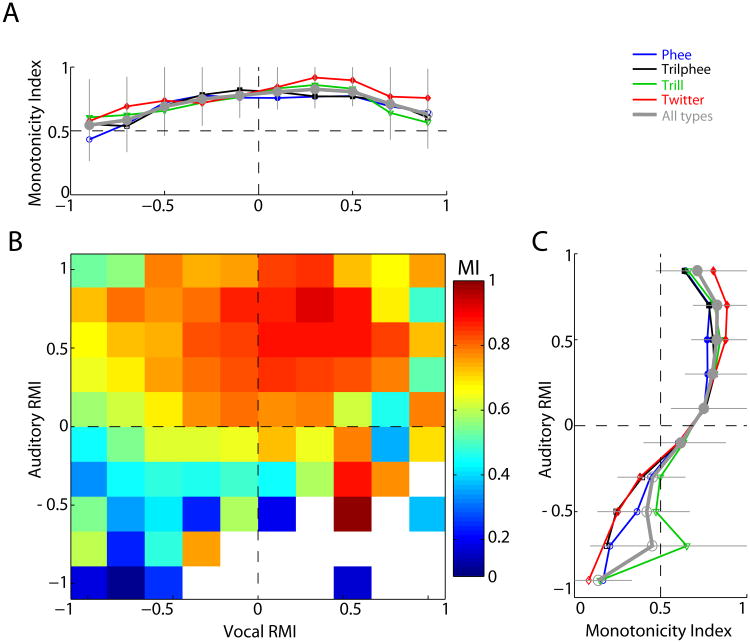
Fig. 5.
Effect of rate-level tuning on vocalization and playback responses. A: Average monotonicity index (MI) for units grouped by vocal RMI, showing equal monotonic and nonmonotonic units for suppression and increasing MI with vocal excitation. Error bars: 95% confidence intervals. B: Two-dimensional plot of mean MI grouped by both vocal and auditory RMI, showing the largest MIs for units excited by both vocalization and playback and smallest MIs for units suppressed by both. Color bar (right) indicates the MI scale. C: Average MI grouped by auditory RMI.

