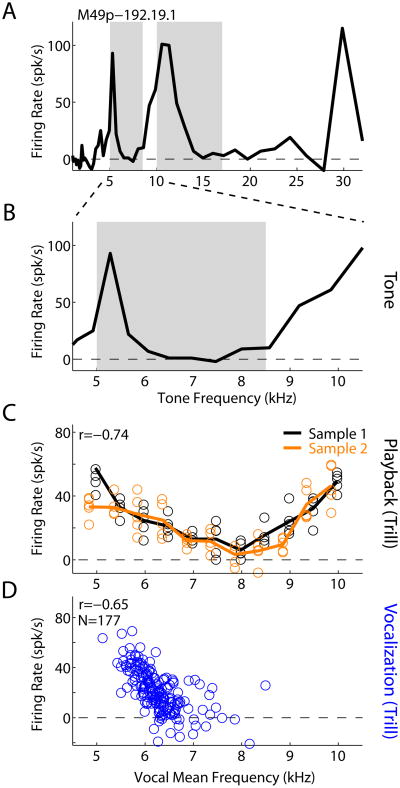
Fig. 6.
Sample unit frequency tuning and vocal responses. A: Tone frequency tuning curve exhibiting multi-peaked frequency tuning. Shaded: range of fundamental frequency and first harmonic for trill vocalizations recorded during the same testing session. B: Expansion of the frequency tuning curve focusing on the vocal range. C: Responses to individual samples (circles) and mean response (line) to the playback of two trill exemplars (orange, black) acoustically modified to sample a range of mean frequencies. Trill frequency tuning qualitatively reflects tone-based tuning in B. D: Firing rates are plotted against the mean frequency of self-produced trill vocalizations. Correlation coefficients of responses with mean vocal frequency are indicated.

