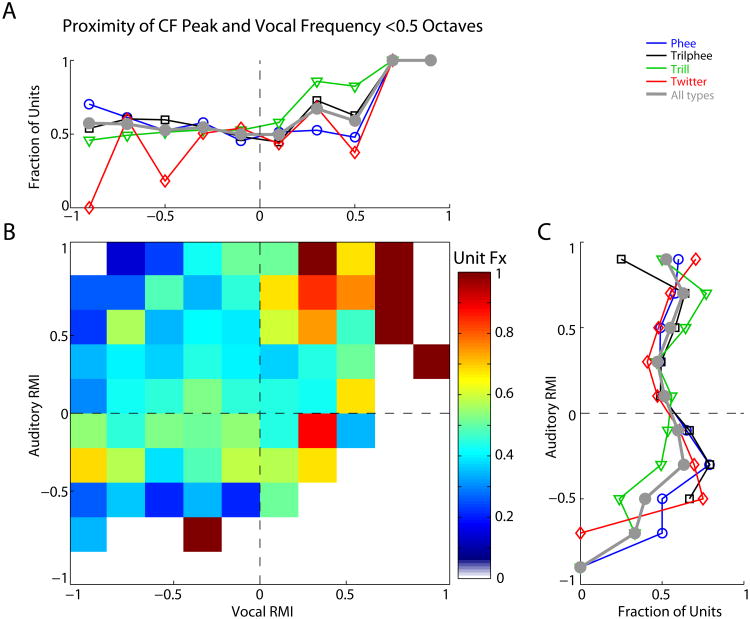
Fig. 8.
Effect of frequency tuning on vocalization and playback responses. The distance between vocal frequency (either fundamental or any harmonic) and the nearest frequency peak was measured. A: Fraction of units with a CF peak-vocal frequency difference < 0.5 octaves is plotted against vocal RMI. Unit fraction with close proximity was relatively constant except for units excited by vocalization, where it was increased. B: Two-dimensional histogram of unit fraction grouped by both vocal and auditory RMI, showing the largest overlapping fraction for units excited by both vocalization and playback. Colorbar (right) indicates the unit fraction scale. D: Unit fraction grouped by auditory RMI.

