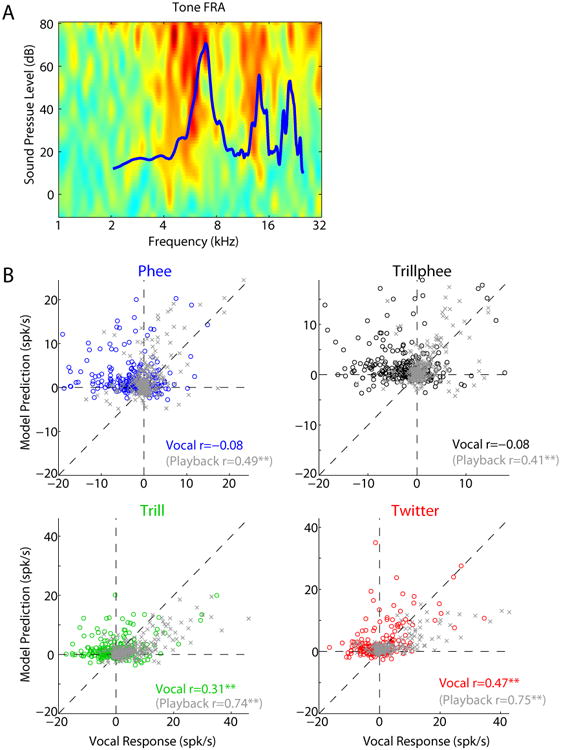
Fig. 9.

Linear frequency response area model of mean vocalization responses. A: Illustration of the FRA-based model. A smoothed tone-measured FRA is shown overlaid with the power-spectral density function from a sample phee vocalization. The firing rate response from the overlapping bins was averaged to calculate the model prediction. B: Scatter plots comparing measured unit mean firing rates during vocal production and model predictions for all four major vocalization types (colored). Comparisons between units' mean playback responses and model predictions are shown in grey. Model predictions were better for playback than during vocal production, particularly for phee and trillphee vocalizations. (** p<0.001).
