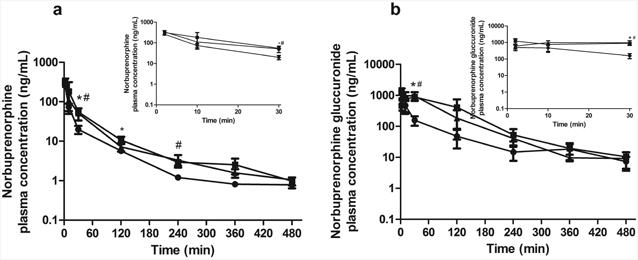
Figure 1. Maternal plasma concentration-time profiles.

Shown are maternal plasma concentration-time profiles of norbuprenorphine (a) and norbuprenorphine-β-D-glucuronide (b) over 480 min after retro-orbital injection of 1 mg/kg norbuprenorphine to pregnant wild-type (circle), Abcb1a-/-/1b-/- (triangle) and Abcb1a-/-/1b-/-/Abcg2-/- (square) mice. Data are shown as means ± SD from three mice at each time point. Statistically significant differences between wild-type and Abcb1a-/-/1b-/- or Abcb1a-/-/1b-/-/Abcg2-/- mice were analyzed by ANOVA analysis for multiple comparisons followed by a Bonferroni correction assuming a significance of 0.05. * indicates p < 0.05 for Abcb1a-/-/1b-/- mice; # indicates p < 0.05 for Abcb1a-/-/1b-/-/Abcg2-/- mice. Inserts show early time points up to 30 min in an expanded format.
