Table 1.
Endoscopic imaging modalities for detection of dysplasia in Barrett’s esophagus
| Imaging modality | Description | Sensitivity | Specificity | Image | References |
|---|---|---|---|---|---|
| High-definition white light (HD-WLE) | HD-WLE is the current criterion standard for both screening and surveillance of BE. | 40–64% | 98%–100% |
 Endoscopic image of BE with areas of early neoplasia. |
[67, 79, 150] |
| Narrow-band imaging (NBI) | NBI visually emphasizes vascular patterns allowing for better differentiation between columnar and squamous tissue in the esophagus. | 94%* | 94%* |
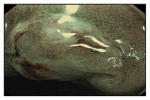 Nodular lesions visualized with NBI. |
[85, 150] |
| Chromoendoscopy methylene blue | Endoscopic evaluation of mucosa after application of dyes or contrast agents. | 64%* | 96%* |
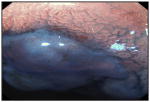 Focal staining of BE mucosa with methylene. blue |
[85, 150] |
| Acetic acid | 97%* | 85%* |
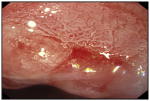 An irregular white area on Barrett’s mucosa after treated with acetic acid. |
[85, 150] | |
| Autofluorescence imaging (AFI) | Relies on spectroscopic characteristics of light to induce fluorescence of biomolecules that can be used to detect mucosal abnormalities. | 37%–50% | 61%–92% |
 AFI image of a neoplastic lesion in BE. |
[150–153] |
| Confocal laser endomicroscopy (CLE) | Provides up to a 1000-fold magnification of the esophageal mucosa and allows for real-time histologic evaluation of the esophagus via endoscope and probe-based methods. | 90%* | 90%* |
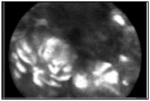 Dysplastic BE with intense intracellular fluorescence, heterogeneous cellular sizes and disorganized architecture. |
[85, 154] |
| Optical coherence tomography (OCT) | Uses light waves to generate cross sectional images of the esophageal epithelial and sub-epithelial tissue atchitecture. | 68%–83% | 75%–82% |
 OCT image of IMC/HGD showing disorganized architecture and increased surface |
[155, 156] |
| Volumetric laser endomicroscopy (VLE) | Uses OCT to produce fast, high-resolution images to a depth of 3 mm and can scan larger surface areas compared with OCT. | 86%* | 88%* |
 VLE images irregular glandular architecture and increased surface reflectivity. |
[85, 154] |
| Spectroscopy | Include several types such as light-scattering, reflectance and Raman spectroscopy that use scattered light to differentiate abnormal vascular, nuclear, and tissue patterns. | 86–90% | 85%–90% |
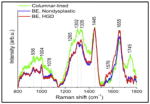 Mean confocal spectra of columnar epithelium, NDBE, and BE with HGD. |
[157–159] |
BE, Barrett’s esophagus.
Pooled estimate generated from ASGE PIVI analysis [85].
