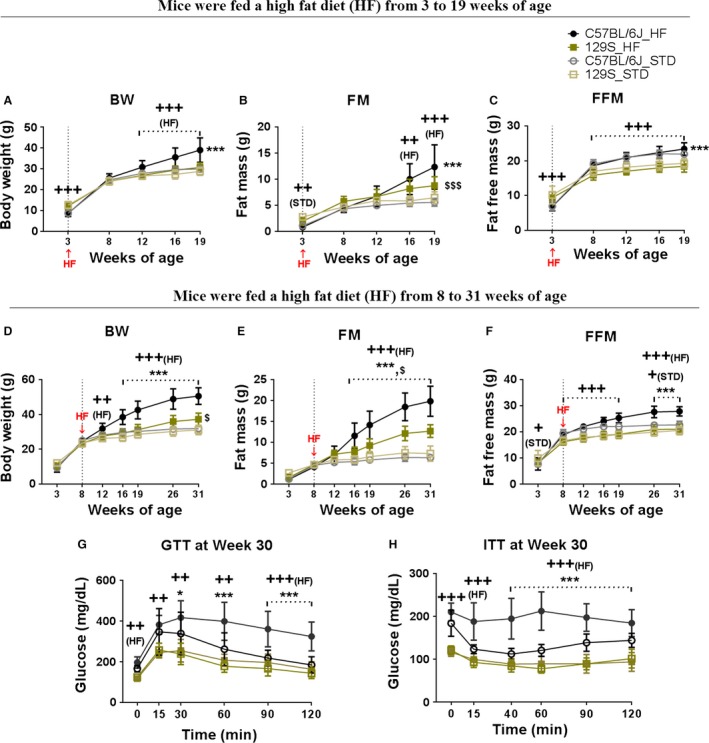
Figure 2.

Variation in DIO between C57BL/6J and 129S mice initially consuming high fat diet from 3 or 8 weeks‐of‐age. C57BL/6J (B6) and 129S males were fed with a high fat diet (HF) or a STD from 3 weeks until 19 weeks‐of‐age, and from 8 weeks until 31 weeks‐of‐age. Body weight (A and D), fat mass (B and E), and fat‐free mass (C and F) were measured at indicated time points (3, 8, 12, 16, 19, 26, and 31 weeks‐of‐age). At 30 weeks‐of‐age, glucose tolerance (G) and insulin sensitivity (H) were tested in all groups. Data shown in graphs are the mean ± SD (error bars) with n = 11–16 (A–C) and 8–11 (D–H). Significant levels are indicated by (*) B6 fed with a HF (C57BL/6J _HF) group relative to B6 fed with a STD (C57BL/6J_STD) group, ($) 129S fed with a HF (129S_HF) group relative to 129S fed with a STD (129S_STD) group, and (+) B6 group relative to 129S group in the same diet. Differences between groups were analyzed for statistical significance by two‐way ANOVA with multiple comparisons, significance levels indicated by *,+,SP≤0.05, **,++,SS P ≤ 0.01, and ***,+++,SSS P ≤ 0.001. STD, standard chow diet
