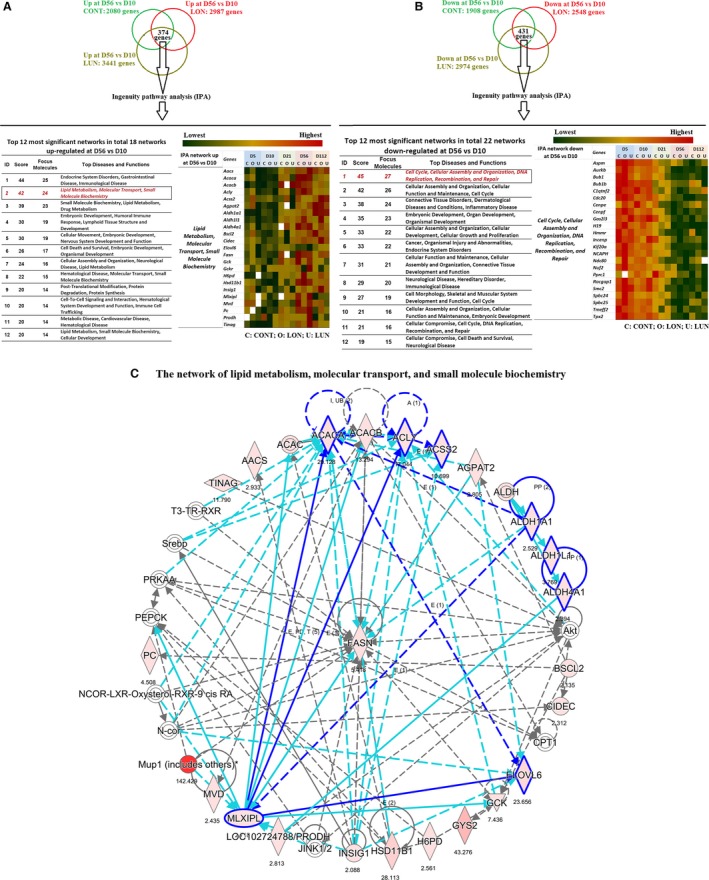
Figure 3.

Up‐ and downregulated networks of development and metabolism in inguinal fat of C57BL/6J mice at 56 days (D56) versus 10 days (D10) of age. Microarray gene expression data was obtained from ING fat tissues of C57BL/6J mice at 5, 10, 21, 56, and 112 days of age. From birth to weaning (21 days of age), mice were kept with mothers who were fed a standard diet (Control – CONT), or a HF (overnutrition – LON), or a STD with reduced food availability (undernutrition – LUN) as described in Kozak et al. (Kozak et al. 2010). From 21 to 56 days of age, all offspring were fed a STD, then from 56 to 112 days of age, they were fed a HF. Fifteen experimental groups (3 diets × 5 ages) each contained a pooled of RNA from 12 mice. Each pool of RNA was analyzed by microarrays in triplicate. (A) Upregulated networks were obtained using IPA ®, QIAGEN Redwood City, www.qiagen.com/ingenuity) to analyze 374 genes upregulated at D56 versus D10. A heat map presents the signals of microarray data of genes in one of the most upregulated network. (B) Downregulated networks were obtained using IPA to analyze 431 genes downregulated at D56 versus D10. A heat map presents the signals of rough microarray data of genes in one of the most downregulated networks. (C) The “Lipid Metabolism, Molecular Transport, and Small Molecule Biochemistry” is one of the most significant networks upregulated at D56 versus D10; it is presented with a graph made by IPA from the data of mice reared under CONT conditions. The values recorded under each gene represent the fold change of microarray gene expression data at D56 versus D10. IPA, ingenuity pathway analysis.
