
Figure 3.
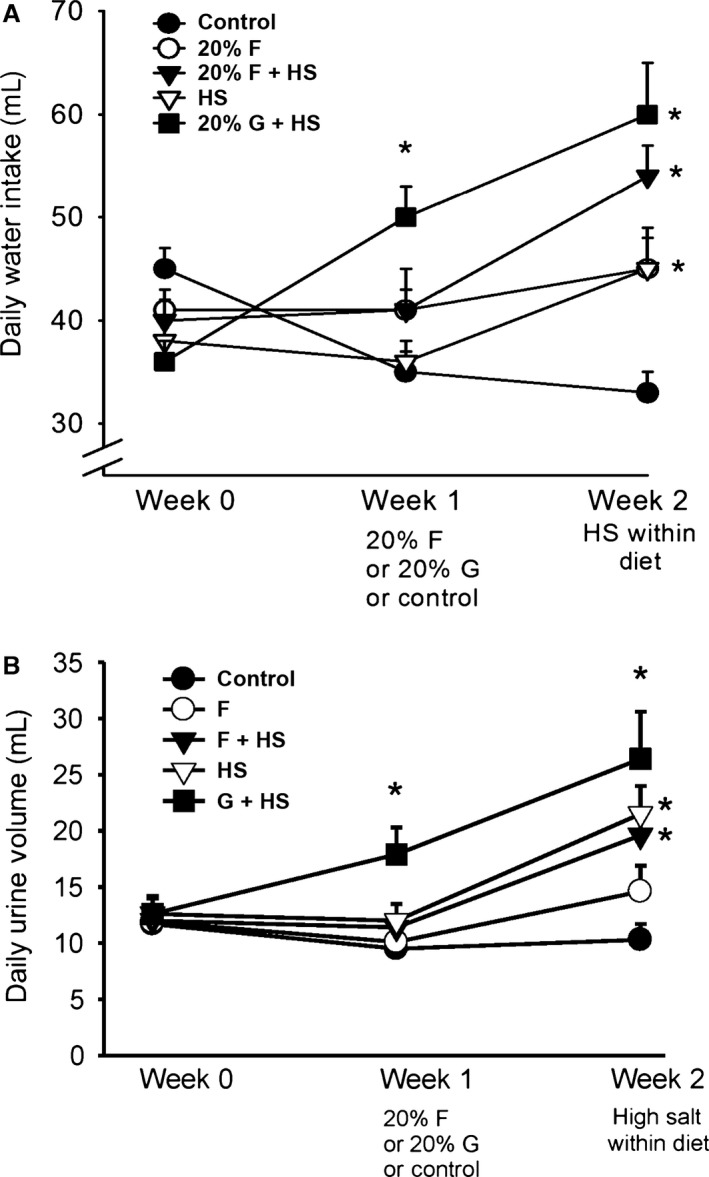
Water balance. Water intake (A, upper panel) increased only in the 20% glucose plus high salt diet during the first week. However, water intake increased during the second week in all three groups receiving a high salt diet. (*P < 0.05 consumption vs. the previous week). Daily urine volume (B, lower panel) increased as the volume consumed increased. Urine volume increased significantly in the 20% glucose plus high salt group in the first week. Urine volumes increased in all three high salt‐treated groups during the second week. (*P < 0.05, as measured within same group from previous week).