
Figure 6.
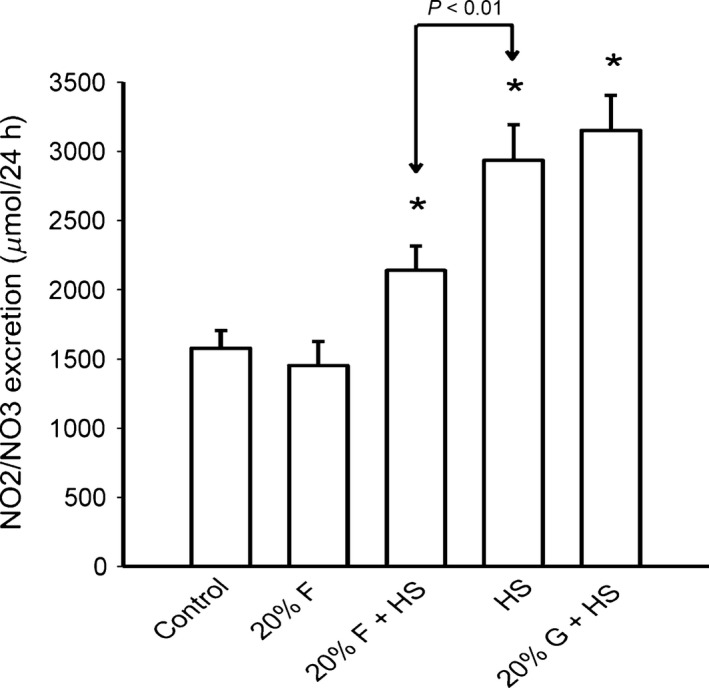
NO2/NO3 excretion: NO2/NO3 excretion was higher than normal salt controls in all three groups fed a high salt chow (*P < 0.05), but the rise in NO2/NO3 excretion was blunted in the 20% fructose + high salt group compared to either high salt or 20% glucose + high salt groups (P < 0.01).