
Figure 2.
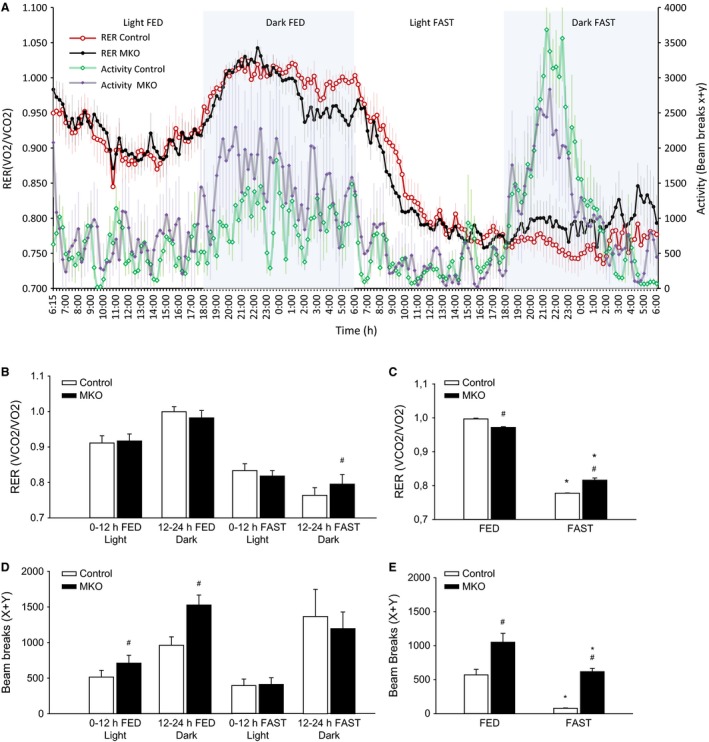
(A) Forty‐eight hours of continuous respiratory exchange ratio (RER) and locomotor activity. (B) Average RER divided into light and dark phases of both the 24 h fed and 24 h fasting intervention. (C) Average RER in the last hour of the fed and the fasted state. (D) Average locomotor activity divided into light and dark phases of both the 24 h fed and 24 h fasting intervention. (E) Average locomotor activity in the last hour of the fed and the fasted state in skeletal muscle‐specific PGC‐1α knockout (MKO) and littermate‐floxed control (control) mice. Values are given as mean ± SE (n = 8–10). *Significantly different from FED within given genotype (P < 0.05). #Significantly different from control within given group (P < 0.05).