
Figure 3.
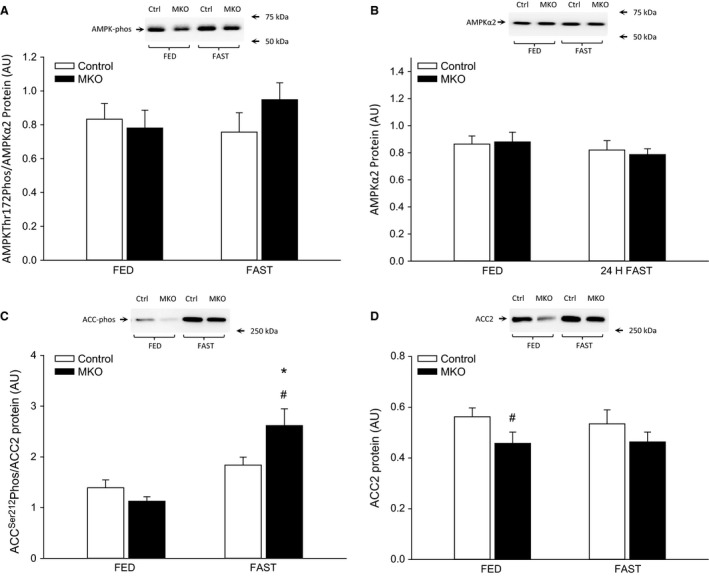
(A) AMPK Thr172 phosphorylation normalized to AMPK α2 protein content, (B) AMPK α2 protein content, (C) acetyl‐CoA carboxylase 2 (ACC2) Ser212 phosphorylation normalized to ACC2 protein content, (D) ACC2 protein content in quadriceps from fed (FED) and 24 h fasted (FAST) skeletal muscle‐specific PGC‐1α knockout (MKO) and littermate floxed controls (control) mice. Values are given as mean ± SE (n = 11). Protein and phosphorylation (phos) levels are given in arbitrary units (AU). *Significantly different from FED within given genotype (P < 0.05). #Significantly different from control within given group (P < 0.05).