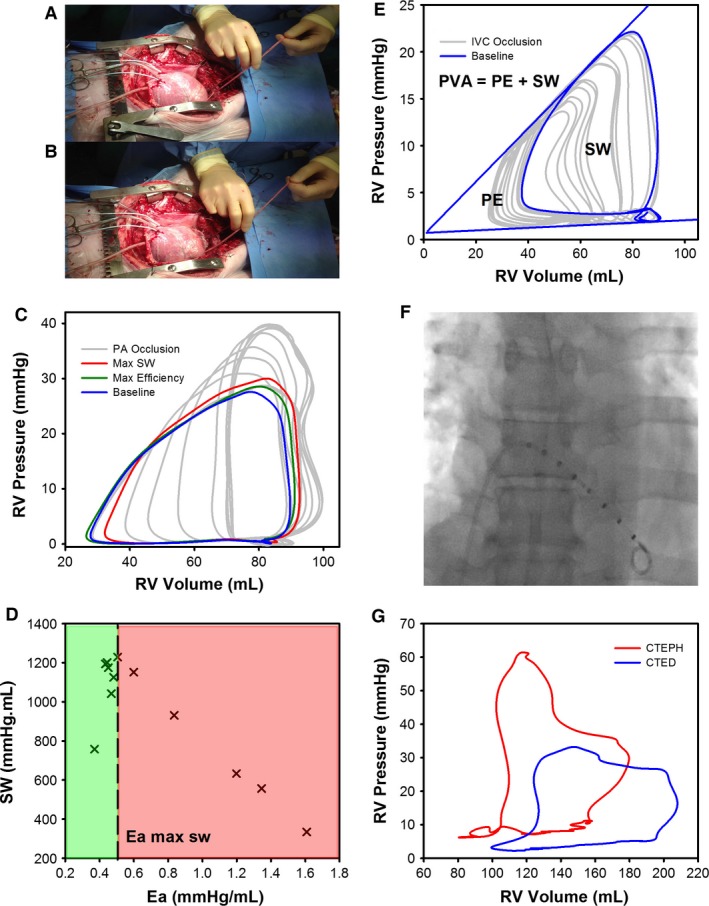
Figure 1.

(A) Animal model porcine heart instrumented with conductance catheter; (B) with PA snare partially occluded to increase RV afterload; (C) RV PV‐loops recorded during the PA snare. PV‐loops are highlighted at baseline (blue), maximal efficiency (green) and maximal SW (Red). (D) SW‐Ea RV PV‐loop relationship during the PA snare, (green) RV energetic reserve, (red) RV failure. (E) RV PV‐loops recorded during an IVC occlusion. PV‐loops are highlighted at baseline (blue). SW is highlighted as the area contained within the baseline RV PV‐loop. PE is the area within the Ees and EDPVR pressure volume relationships. (F) Fluoroscopic image of conductance catheter located in the RV during the clinical study; (G) Typical RV PV‐loop morphology recorded for patients with CTED (blue) or CTEPH (red).
