Figure 5.

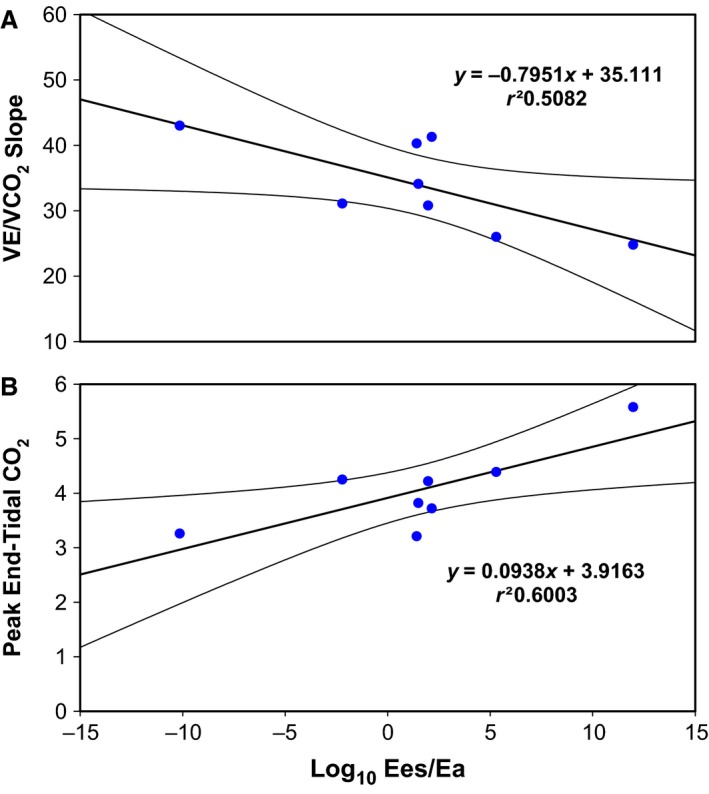
The individual data points for the patients with CTED (n = 8) for the relation between Ees/Ea and cardiopulmonary exercise (A) VE/VCO2 and (B) peak end‐tidal CO2. Linear regression lines with 95% confidence intervals are displayed.

The individual data points for the patients with CTED (n = 8) for the relation between Ees/Ea and cardiopulmonary exercise (A) VE/VCO2 and (B) peak end‐tidal CO2. Linear regression lines with 95% confidence intervals are displayed.