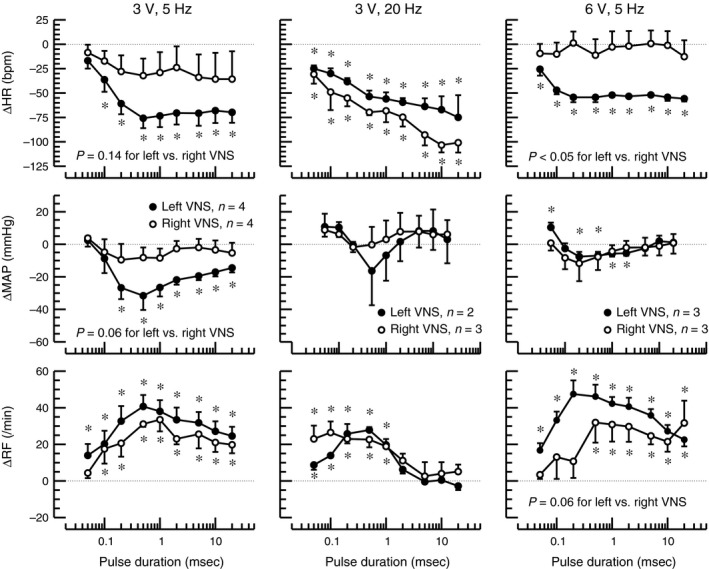
Figure 2.

Changes (Δ) in heart rate (HR), mean arterial blood pressure (MAP), and respiratory frequency (RF) in response to left‐ (closed circles) or right‐sided (open circles) cervical vagal nerve stimulation using increasing pulse durations (x‐axes) of charge‐balanced rectangular impulses of 3 V or 6 V and 5 Hz or 20 Hz stimulation frequency. Absolute baseline values are provided in Table 1. *: P < 0.05 for difference of absolute values at the respective pulse duration and preceding baseline. P‐values for comparison of left versus right vagal nerve stimulation (VNS) are for group factor in 2‐way Analysis of Variance (ANOVA) with factors for right versus left VNS and for pulse duration. The number of animals for the three combinations of stimulation voltage and frequency are provided in the graphs for ΔMAP and also apply for ΔHR and ΔRF.
