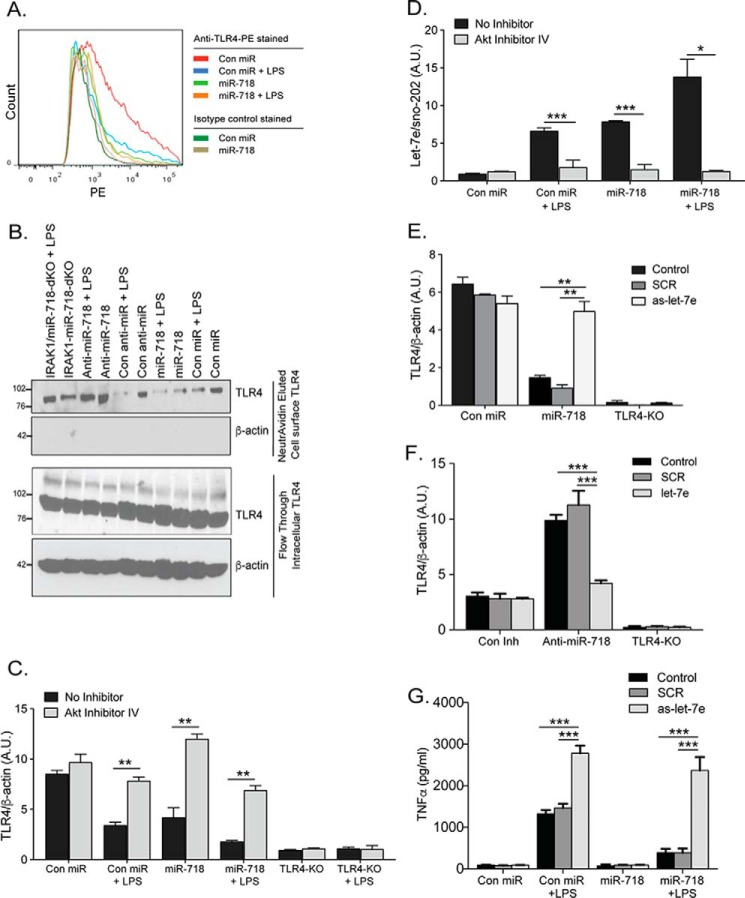
Figure 6.
TLR4 cell surface expression is repressed in the presence of miR-718. A, Con miR and miR-718 macrophages were stimulated with 100 ng/ml LPS for 2 h, stained for TLR4 using TLR4-phosphatidylethanolamine (PE)-conjugated antibody, and analyzed by flow cytometry. B, cell surface protein biotinylation and isolation were performed using the Pinpoint cell surface protein isolation kit from Pierce. Con miR, miR-718, Con Inh, Anti-miR-718, and Irak1/miR-718-dKO cells were stimulated with 100 ng/ml LPS for 2 h and then labeled with EZ-Link sulfo-NHS-SS-biotin. These cells were then lysed and isolated with immobilized NeutrAvidin gel. The bound proteins were released by incubation with SDS-PAGE sample buffer containing 50 mm DTT. The flow-through and elution were kept for analysis of TLR4 protein expression by immunoblotting. C, immortalized Con miR, miR-718 and TLR4-KO macrophages were either left untreated or pretreated with 10 μm Akt inhibitor IV and then stimulated with LPS for 2 h. RNA was extracted, and TLR4 expression was quantitated by SYBR Green qPCR. Levels of TLR4 are shown relative to levels of β-actin. D, immortalized Con miR and miR-718 macrophages were either left untreated or pretreated with 10 μm of Akt inhibitor IV and then stimulated with LPS for 2 h. RNA was extracted, and let-7e expression was quantitated by TaqMan qPCR. Levels of let-7e are shown relative to levels of sno-202. E, immortalized Con miR, miR-718, and TLR4-KO macrophages were transfected with 50 nm as-let-7e or SCR-miRNA using Lipofectamine 2000. RNA was extracted 48 h after miRNA transfection, and TLR4 mRNA was quantitated by SYBR Green qPCR. F, immortalized Con Inh, Anti-miR-718, and TLR4-KO macrophages were transfected with 50 nm let-7e or SCR-miRNA using Lipofectamine 2000. RNA was extracted 48 h after miRNA transfection, and TLR4 mRNA was quantitated by SYBR Green qPCR. G, immortalized Con miR and miR-718 macrophages were transfected with 50 nm as-let-7e or SCR-miRNA using Lipofectamine 2000. Cells were then stimulated with LPS for 2 h, and TNFα production was measured by ELISA. The data shown represent the mean ± S.D. of triplicate determinations and are representative of three independent experiments with similar results. A.U., arbitrary units. *, p < 0.05; **, p < 0.005; ***, p < 0.0005.

