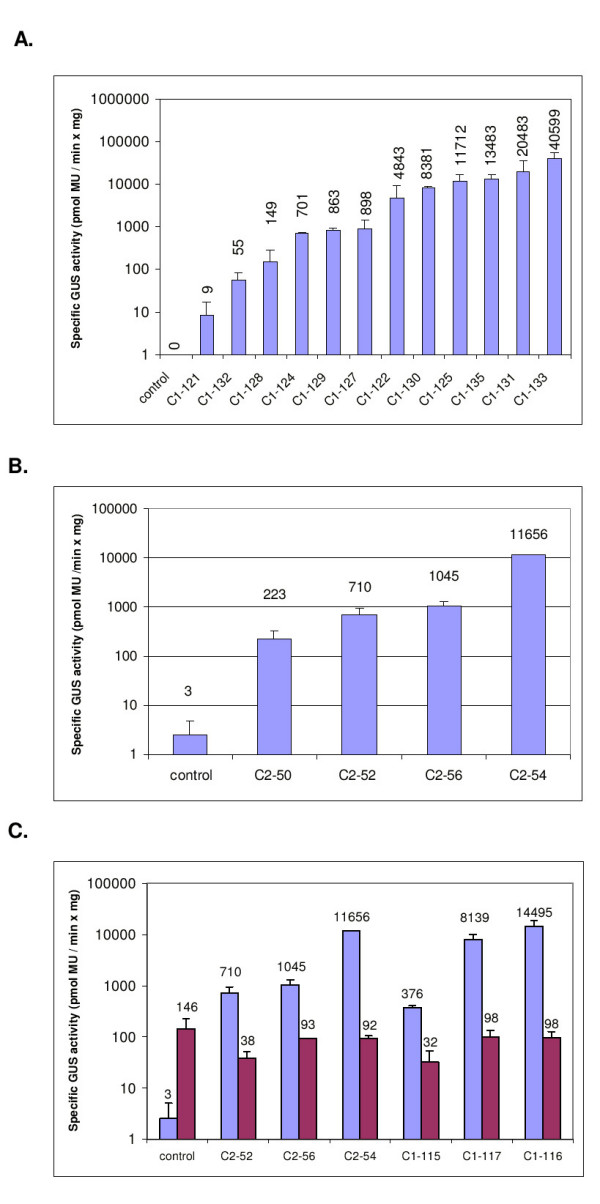
Figure 4.

GUS activity of cab11 and cab12 promoter reporter gene constructs in leaves and roots of transgenic sugar beets. GUS activity was assayed using total protein prepared from the leaf or root. Each bar represents the activity of an individual transformant. The data are presented as the mean of three individual plants per transformant. The error bar describes the standard deviation of the mean. A. Activity of the cab11 promoter in leaves of transgenic sugar beet plants. B. Activity of the cab12 promoter in leaves of transgenic sugar beet plants. C. Comparison of the activity of the cab11 and cab12 promoter in leaves and roots of sugar beet. The GUS activity of the leaf extracts is shown by the left column and the activity of the root extracts by the right column.
