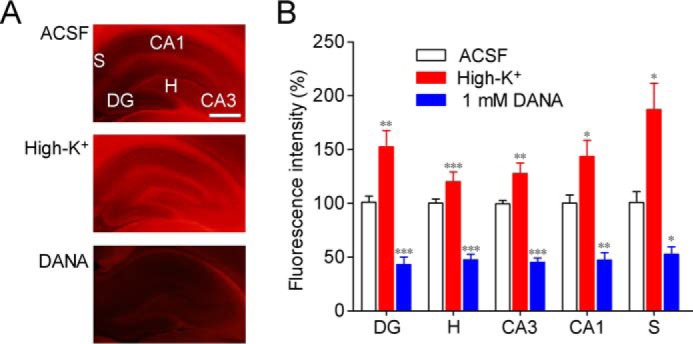
Figure 2.

Sialidase activity imaging with X-Neu5Ac and FRV LB. A, sialidase activity in rat hippocampal acute slices was imaged using X-Neu5Ac and FRV LB in ACSF, high-K+ solution, or ACSF containing 1 mm DANA. B, relative fluorescence intensities in each region are shown. DG, dentate gyrus; H, hilus, CA, cornus ammonis, S, subiculum. *, p < 0.05; **, p < 0.01; and ***, p < 0.001 versus control (one-way ANOVA or Kruskal-Wallis test with Dunn's multiple comparison test). Scale bar, 1 mm. Error bars represent S.E.
