Figure 3.
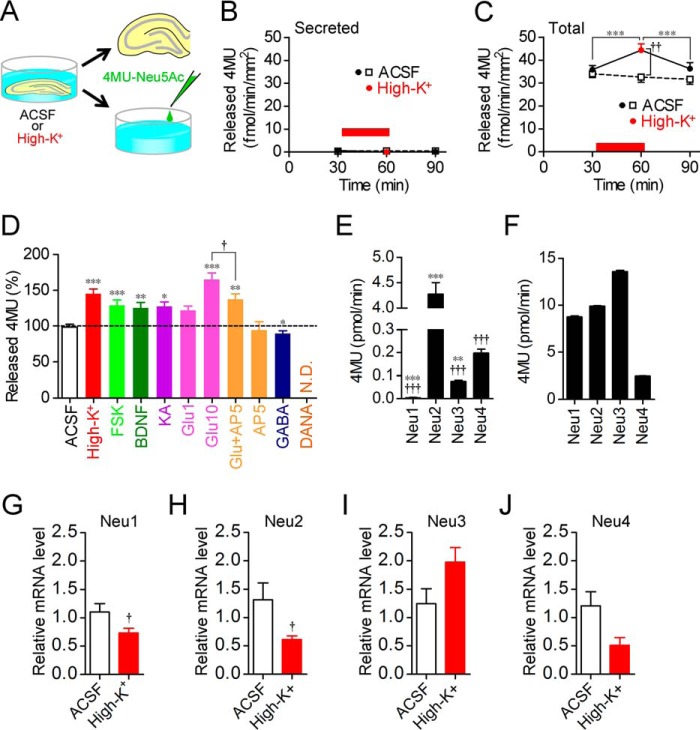
Factors responsible for increase in sialidase activity. A, schematic of secreted sialidase activity measurement with 4MU-Neu5Ac. B, secreted sialidase activity was not changed by neural excitation with high-K+. n = 12 each. C, total sialidase activity in slices, which were prepared from the same rats as those used for the secreted sialidase activity measurement, was monitored in the same manner as in Fig. 1. n = 12 each. ***, p < 0.001 (one-way repeated measures ANOVA); ††, p < 0.01 (unpaired t test). High-K+ solution was applied at the time point indicated by a red bar. D, sialidase activities were measured for 30 min in the presence of 100 mm KCl (high-K+; n = 8), 50 μm forskolin (FSK; n = 15), 200 ng/ml BDNF (n = 16), 5 μm kainite (KA; n = 8), 1 (n = 8) or 10 (n = 19) mm glutamate (Glu), 10 mm glutamate with 50 μm AP5 (n = 13), 50 μm AP5 (n = 8), 10 μm GABA (n = 8), or 1 mm DANA (n = 10) after measurement of basal sialidase activity levels for 30 min. The dashed line shows basal sialidase activity levels. *, p < 0.05; **, p < 0.01; and ***, p < 0.001 versus baseline level (two-way repeated measures ANOVA); †, p < 0.05 (one-way ANOVA). N.D., not detected. E and F, cleavage of 4MU-Neu5Ac with each of the recombinant rat sialidase isozymes. C-terminal Myc-tagged rat sialidase isozymes Neu1, Neu2, Neu3, and Neu4 were expressed in C6 rat glioma cells. Each lysate equalized with the amount of Myc was incubated in ACSF (E; pH 7.3; n = 4) or sodium acetate buffer (F; pH 4.6; n = 4) containing 200 μm 4MU-Neu5Ac. The amount of hydrolyzed 4MU is shown as a bar graph. †††, p < 0.001 versus Neu2; **, p < 0.01; and ***, p < 0.001 versus Neu4 (one-way ANOVA) in E. All combinations in F had significance (p < 0.001, one-way ANOVA). G–J, quantitative measurement of Neu1 (G), Neu2 (H), Neu3 (I), and Neu4 (J) mRNA levels in hippocampal slices after incubation with ACSF or 100 mm KCl. †, p < 0.05 (unpaired t test). Error bars represent S.E.

