Figure 4.
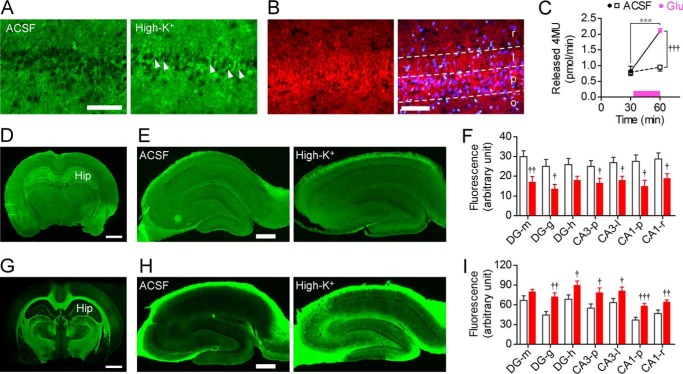
Influence of neural excitation on subcellular localization of sialidase activity and sialylated motif detected by MAA lectin. A, hippocampal slices (20 μm in thickness) were prepared after incubation with ACSF (left panel) or 100 mm KCl (right panel) for 30 min and then stained with 100 μm BTP3-Neu5Ac (pH 7.3). Arrowheads indicate intense fluorescence in the cell membrane of pyramidal cells. Scale bar, 100 μm. B, immunohistochemical staining of Neu4 (red). Counterstaining was performed using DAPI (blue). r, stratum radiatum; l, stratum lucidum; p, stratum pyramidale; o, stratum oriens. Scale bar, 100 μm. C, effect of 100 μm glutamate on sialidase activity measured by 4MU-Neu5Ac in cultured primary rat hippocampal astrocytes. Glutamate (Glu) was applied at the time point indicated by a bar. ACSF, n = 7; glutamate, n = 8. ***, p < 0.001 (paired t test); †††, p < 0.05 (unpaired t test). D–I, cleavage of sialic acid residues by neural excitation. Brain slices (D and G; scale bar, 2 mm) and hippocampal slices after incubation with ACSF (left) or 100 mm KCl (right) for 30 min (E and H; scale bar, 0.5 mm) were stained using FITC-labeled lectins MAA (D and E) and PNA (G and H), respectively. DG, dentate gyrus; Hip, hippocampus; m, stratum moleculare; g, stratum granulosum; h, hilus. Quantification of the binding of MAA and PNA lectins to the hippocampal slices (F, MAA, n = 11 in ACSF, n = 8 in high-K+; I, PNA, n = 18 in ACSF and high-K+). †, p < 0.05; ††, p < 0.01; and †††, p < 0.001 versus ACSF (unpaired t test). Error bars represent S.E.

