
Figure 5.
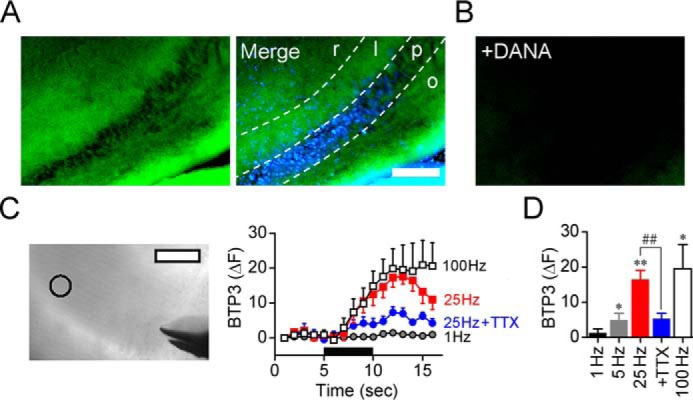
Spatiotemporal dynamics of sialidase activity in LTP induction. A, sialidase activity in the hippocampal CA3 region was visualized with 100 μm BTP3-Neu5Ac (pH 7.3) by using rat acute hippocampal slices (400 μm in thickness). BTP3-Neu5Ac, green; DAPI, blue. Scale bar, 200 μm. r, stratum radiatum; l, stratum lucidum; p, stratum pyramidale; o, stratum oriens. B, BTP3-Neu5Ac staining with 10 mm DANA. C, fluorescence intensity was monitored at the CA3 stratum lucidum (open circle in transmitted light image). Scale bars, 100 μm. The black bar represents a time period in which stimulation (1–100 Hz) was applied to the MF. D, the bar graph shows averaged fluorescence intensities measured after 5 s of stimulation. 1 Hz, n = 5; 5 Hz, n = 5; 25 Hz, n = 7; 25 Hz + 1 μm TTX, n = 7; 100 Hz, n = 5. *, p < 0.05; and **, p < 0.01 versus baseline level (paired t test); ##, p < 0.01 (unpaired t test). Error bars represent S.E.