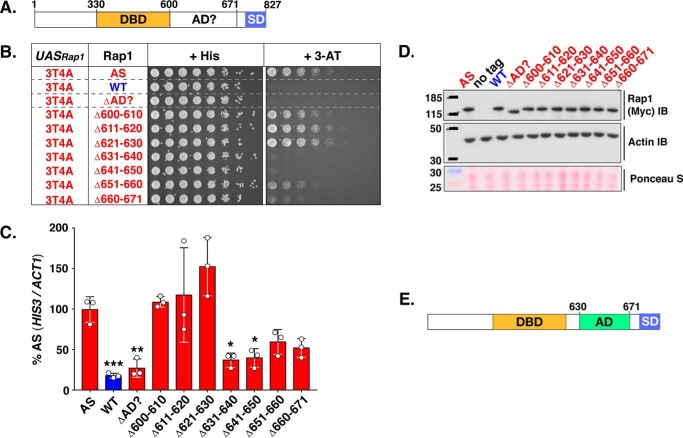
Figure 5.
Mapping the activation domain of Rap1 to amino acids 630–671. A, schematic of the Rap1 protein. Shown are the well characterized Rap1 DNA DBD (aa 330–600) and silencing domain (SD) as well as the region suspected to contain the AD (AD? 600–671). B, growth analysis of yeast strains carrying the 3T4A version of the HIS3 reporter (left column, UASRap1-red; labeled 3T4A) and various forms of Rap1 (labeled Rap1, 2nd column) either Rap1AS (AS, red), Rap1WT (WT, blue), or the indicated Rap1AS deletion mutant (ΔAD?, Δ600–610, Δ611–620, Δ621–630, Δ631–640, Δ641–650, Δ651–660, Δ660–671; red). Serial dilutions of cells were plated and grown on non-selective (+ His), or reporter gene-selective (+ 3-AT) media as in Figs. 3B and 4A. Images are representative of three independent replicates. C, qRT-PCR analysis to score reporter HIS3 mRNA expression levels in the various yeast strains tested in B. Results of these analyses are plotted as in Fig. 4B, except that data are expressed as a percentage of the relative HIS3 mRNA levels in yeast carrying Rap1AS instead of Rap1WT. Data represent three biological replicates (white circles) measured in duplicate. Mean ± S.D. is depicted. *, p < 0.05; **, p < 0.01; ***, p < 0.005. D, immunoblot analysis of Rap1AS, Rap1WT, and Rap1AS deletion variant protein expression levels. This analysis was performed as detailed in Fig. 4C. Images are representative of three independent replicates. E, schematic indicating the location of the Rap1 activation domain (AD; aa 630–671) mapped through the deletion mutagenesis experiments shown here.

