Figure 5.
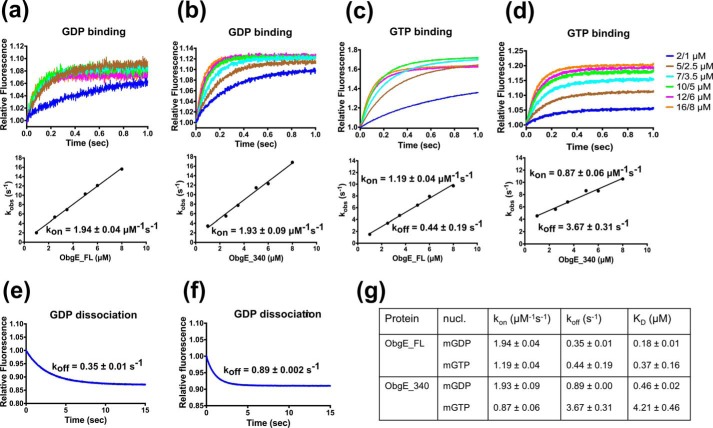
GDP and GTP binding and dissociation kinetics of ObgE_FL (a, c, and e) and ObgE_340 (b, d, and f) determined via stopped flow fluorescence analysis. a and b, transients obtained by following mGDP (0.2/0.1 μm, before/after mixing) fluorescence upon rapid mixing with different concentrations of ObgE_FL (a) and ObgE_340 (b). Concentration values given on the graph represent ObgE concentrations before and after mixing. The lower panels show the concentration dependence of the observed rate constant (kobs). The slope of the linear fit yields kon. c and d, transients obtained by following mGTP (0.2/0.1 μm, before/after mixing) fluorescence upon rapid mixing with different concentrations of ObgE_FL (c) and ObgE_340 (d). The same concentrations as in a and b are used. The lower panels show the concentration dependence of the observed rate constant (kobs). The slope and intercept of the linear fit yield kon and koff, respectively. e and f, direct determination of koff by following the release of mGDP from ObgE_FL (e) and ObgE_340 (f) upon mixing 200 μm unlabeled GDP with a mixture of 0.4 μm ObgE and 1.5 μm mGDP. g, summary of nucleotide binding/dissociation kinetics and the deduced KD values of ObgE_FL and ObgE_340.

