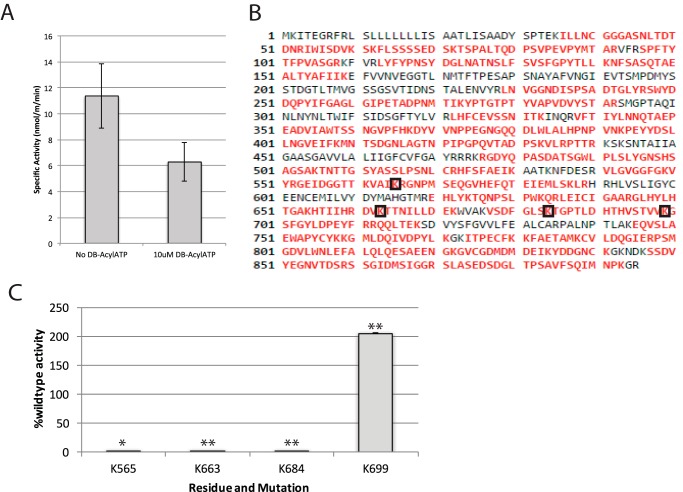
Figure 4.
A, inhibition of specific activity with DB-acyl-ATP treatment. Error bars, S.D., n = 2, p = 0.13. B, sequence diagram of FERONIA. Red type, areas sequenced in MS experiment; black type, unidentified. Black boxes, lysines modified with DB-acyl-ATP. C, specific activity of FERONIA Lys → Arg mutants co-translated with nanodiscs. Specific activity displayed is normalized to percentage of wild-type activity. Error bars, S.D.; n = 2/bar. Asterisks, statistical significance (*, p ≤ 0.05; **, p ≤ 0.01).

