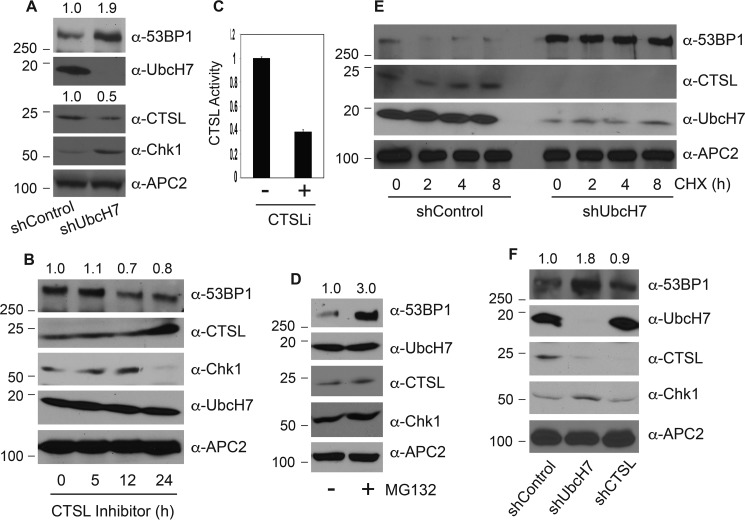
Figure 1.
Mechanisms controlling the basal levels of 53BP1 proteins. A, protein expression in A549 control or UbcH7 stably depleted cells by immunoblotting with the indicated antibodies. The molecular weight marker is shown on the left. B, A549 control cells were treated with 100 nm CTSLi for the indicated times, and protein expression was examined. C, CTSL activity in A549 control cells treated or not with 100 nm CTSL inhibitor for 24 h was monitored as described under “Experimental Procedures.” Data represent the means and S.D. from two independent experiments in triplicate. D, A549 parent cells were treated with 10 μm MG132 or vehicle for 6 h, and protein expression was examined. E, A549 stable cells infected with shRNA targeting control or UbcH7 were treated with 320 μm CHX for 0, 2, 4, and 8 h. Protein expression was monitored. F, A549 cells were stably infected with a control shRNA or those targeting UbcH7 or CTSL, and protein expression was examined. For protein quantitation, the 53BP1 or CTSL band intensity was quantified using NIH Image J software, and relative levels of 53BP1 or CTSL were normalized to that in the control lane and shown above the blot.

