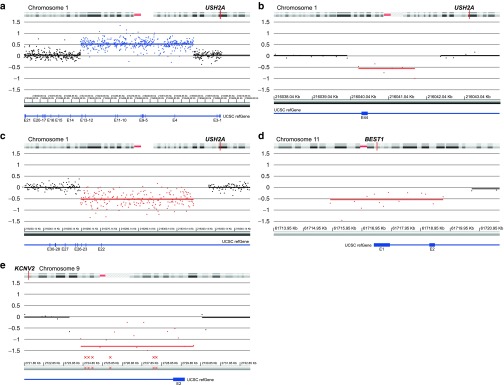
Figure 1.
Array CGH profiles of copy number variations in positive controls. E: exon. Crossed dots indicate probes with a ratio outside the shown y-axis, with no further impact on the calculations. (a) Positive control 1. A heterozygous duplication of exon 4 to exon 13 in USH2A. (b) Positive control 2. A heterozygous deletion of exon 44 in USH2A. (c) Positive control 3. A heterozygous deletion of exons 22 to 24 in USH2A. (d) Positive control 4. A heterozygous deletion of exon 1 and exon 2 in BEST1. (e) Positive control 5. A compound heterozygous deletion of exon 2 in KCNV2.

