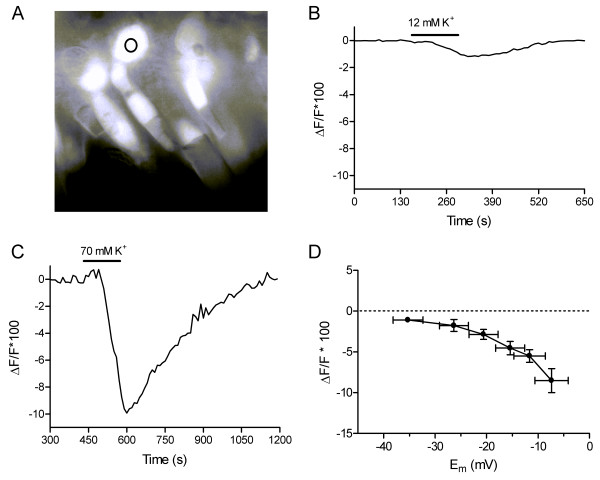
Figure 2.

Intracellular chloride measurements. A. Example of a retinal slice fluorescently stained with the Cl- sensitive dye MEQ. The circle indicates the somatic region of a cone in which MEQ measurements were made. B. An example of the reduction in MEQ fluorescence, indicating an increase in intracellular [Cl-], produced by application of 12.1 mM K+ to a cone. C. A greater decrease in MEQ fluorescence was produced by application of 69.9 mM K+. Different cone from panel B. D. MEQ fluorescence changes produced by bath application of superfusate containing 12.1, 21.6, 31.2, 40.7, 50.3, or 69.9 mM [K+]. After correcting for liquid junction potentials, these high K+ solutions depolarized cones to -35.3 ± 2.90, -26.3 ± 2.82, -20.6 ± 2.82, -15.4 ± 2.84, -11.6 ± 3.05, and -7.4 ± 3.25 mV (n = 9), respectively, determined in current clamp recordings using gramicidin-perforated patch recording techniques. The change in MEQ fluorescence relative to basal fluorescence (ΔF/F*100) is plotted against the cone membrane potential determined with each high K+ solution.
