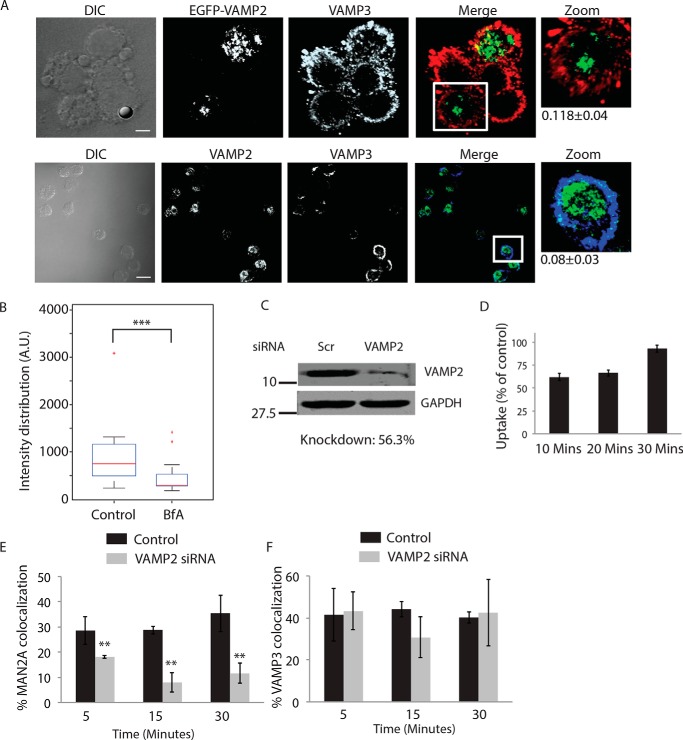
FIGURE 10.
Recruitment of mannosidase-II at phagosomes require secretory vesicle-specific v-SNARE VAMP2. A, upper panel, U937 cells expressing EGFP-VAMP2 were fixed and stained with anti-VAMP3 antibody followed by Alexa Fluor 568-labeled secondary antibody (scale bar, 4 μm). White box in the merge panel identifies the area that was magnified for the zoom panel. Lower panel, U937 cells were fixed and stained with anti-VAMP3 (rabbit) antibody and anti-VAMP2 (mouse) antibody followed by anti-rabbit Alexa Fluor 647 secondary antibody (pseudocolor blue) and labeled anti-mouse Alexa Fluor 488-labeled secondary antibody (scale bar, 15 μm). White box in the merge panel identifies the area that was magnified for the zoom panel. Percent co-localization ± S.D. is marked on the merged images. DIC, differential interference contrast. B, EGFP-VAMP2-expressing U937 cells were incubated with serum-coated latex beads in the presence or absence of BfA for 30 min. Samples were fixed and stained with anti-VAMP3 antibody followed by Alexa Fluor 568-labeled secondary antibody. Images were analyzed using 3D module in Imaris 7.2, and VAMP2 intensity distribution in the latex beads were calculated (***, p value <0.001). C, THP-1-derived macrophages were transfected with VAMP2 siRNA or scrambled siRNA control for 48 h; cells were lysed and probed with anti-VAMP2 antibody in the Western blotting. D, THP-1-derived macrophages were transfected with VAMP2 siRNA and at 48 h post-transfection; uptake of E. coli was assayed in comparison with the control cells that received scrambled siRNA. Uptake of PKH67-labeled E. coli was monitored at 10, 20, and 30 min. Data represent average from three replicates, and error bars are S.D. E, in mCherry-MAN2A-expressing cells, VAMP2 was knocked down and incubated with GFP expressing E. coli for different time points as mentioned. Samples were then fixed and analyzed through a confocal microscope. Data represent average of more than 200 bacteria from two different experiments (values ± S.D.; scale bar). F, in the experiment mentioned in B, samples were also stained with anti-VAMP3 antibody followed by Alexa Fluor 405-labeled secondary antibody and analyzed through a confocal microscope. Data represent average of more than 200 bacteria from two different experiments (values ± S.D.).

