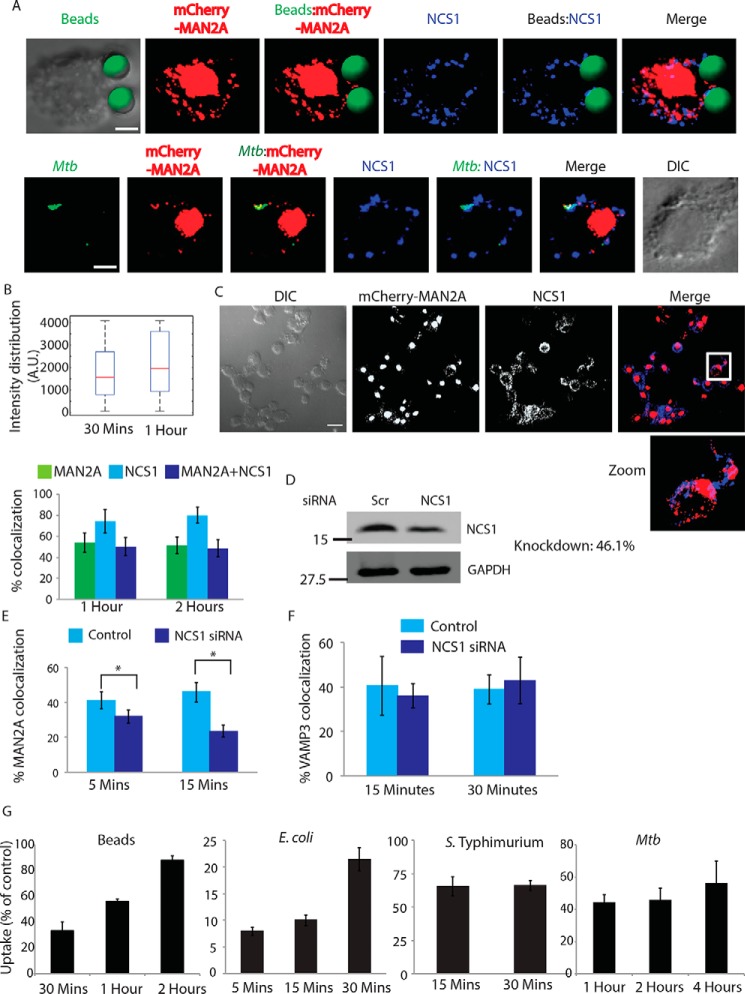
FIGURE 11.
Neuronal calcium sensor (NCS1) in the Golgi apparatus recognizes Ca2+ signal for focal release of mannosidase-II vesicles. A, mCherrry-MAN2A-expressing U937 macrophages were incubated with latex beads (30 min) or infected with PKH67-labeled H37Rv (1 h). Cells were fixed and stained with anti-NCS1 antibody followed by Alexa Fluor 405-labeled secondary antibody. For the upper panel, latex beads were given green pseudo-color using Imaris (scale bar, 4 μm). B, upper panel, in U937 macrophages, incubated with beads for 30 min or 1 h, samples were stained with anti-NCS1 antibody. Presence of NCS1 at the bead surface was calculated using the 3D spot creation module in Imaris 7.2 software. The box plot at right shows data from more than 100 beads from two independent experiments. For lower panel, mCherry-MAN2A (red)-expressing U937-derived macrophages were infected with PKH67-labeled H37Rv (green) for 1 and 2 h. At the respective time points, samples were fixed and stained with anti-NCS1 antibody followed by Alexa Fluor 405-tagged secondary antibody. The images are representative of the 1-h time point. Percent co-localization of H37Rv with mannosidase-II, NCS1, or both mannosidase-II and NCS1 was calculated using Imaris 7.2. The data represent an average of more than 150 bacteria from three different experiments (values ± S.D.). DIC, differential interference contrast. C, co-localization of mannosidase-II and NCS1 in U937 macrophages. U937 macrophages expressing mCherry-MAN2A were stained with anti-NCS1 antibody followed by secondary antibody (pseudo-colored green) (scale bar, 15 μm). White box in the merge panel identifies the area that was magnified for the zoom panel. D, siRNA-mediated knockdown of NCS1 was confirmed by Western blottings on the whole cell lysates from the transfected cells. Knockdown was monitored at 48 h post-transfection. E, THP-1-derived macrophages treated with NCS1 siRNA were incubated with GFP expressing E. coli for 5 and 15 min. Cells were stained with anti-mannosidase-II antibody to assess the recruitment of mannosidase-II at the phagosomes in NCS1-depleted cells. Percent co-localization of E. coli with mannosidase-II was calculated using Imaris 7.2. The data represent an average of more than 150 bacteria from three different experiments (values ± S.E., *, p value <0.05). F, in the similar experiment as mentioned in E, samples were stained with anti-VAMP3 antibody to assess the recruitment of VAMP3 at the phagosomes in NCS1-depleted cells. Percent co-localization of E. coli with mannosidase-II was calculated using Imaris 7.2. The data represent an average of more than 100 bacteria from three different experiments (value ± S.D.). G, THP-1 macrophages were treated with siRNA against NCS1 or scrambled control. At 48 h post-siRNA treatment, cells were monitored to uptake latex beads (1 μm), E. coli, S. typhimurium, or H37Rv for indicated time points. Data are shown as % uptake in the siRNA-treated cells with respect to the scrambled siRNA control-treated cells. Data are representative of three independent experiments (values ± S.D.).

