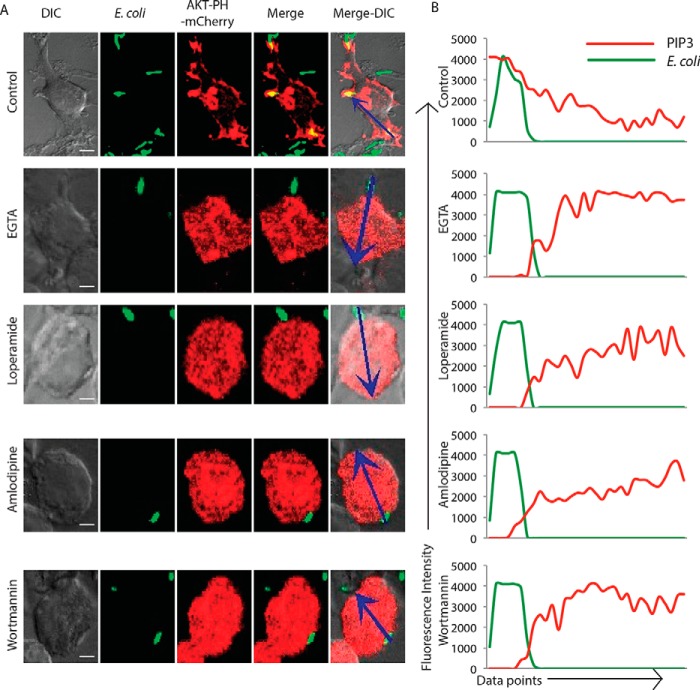
FIGURE 9.
Role of voltage-gated Ca2+ channels in establishing the PIP3 gradient during phagocytosis. A, RAW264.7 macrophages were transfected with AKT-PH-mCherry. At 24 h, cells were incubated with GFP expressing E. coli for 5 min. In parallel, we also had AKT-PH-mCherry-expressing cells that were pretreated with EGTA (3 mm), loperamide (100 μm), amlodipine (100 μm), or wortmannin (5 μm) followed by incubation with GFP expressing E. coli for 5 min. Samples were fixed at 5 min and analyzed by confocal microscopy. The arrows in the far right image in each of the panels highlight the fluorescence intensity measurements for the analysis presented in B (scale bar, 4 μm). DIC, differential interference contrast. B, images in A (arrows) were analyzed using intensity profile line tool in the NIS elements software (see “Materials and Methods”). The data represent median from more than 20 fields for each case.

