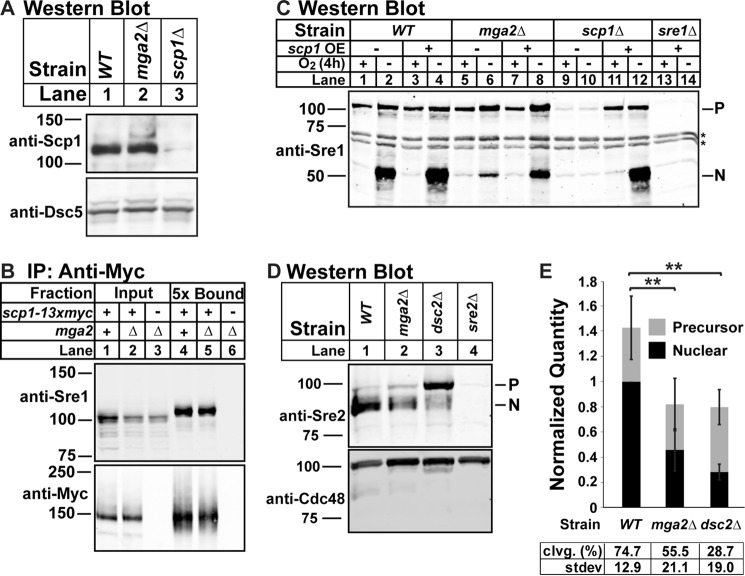
FIGURE 3.
Cleavage defect in mga2Δ cells occurs at a step downstream of Sre1-Scp1 complex formation and is not specific to Sre1. A, Western blot of cell lysates from the indicated strains grown in the presence of oxygen probed with a mixture of anti-Scp1 IgG monoclonal antibodies 8G4C11, 1G1D6, and 7B4A3 (imaged by film) or anti-Dsc5 IgG (imaged by LI-COR Biosciences Odyssey CLx). The blot is representative of four biological replicates. B, WT or mga2Δ cells expressing scp1-13xmyc and mga2Δ cells expressing untagged scp1 were grown in the presence of oxygen, and Scp1-13xMyc was immunoprecipitated (IP) from Nonidet P-40-solubilized membranes using monoclonal anti-Myc 9E10 IgG as described under “Experimental Procedures.” Input and 5-fold enriched bound fractions were analyzed by Western blotting and imaged by LI-COR Biosciences Odyssey CLx using polyclonal anti-Sre1 IgG and polyclonal anti-Myc IgG. The blot is representative of three biological replicates. C, indicated strains expressing vector (−) or scp1 (+) from a cauliflower mosaic virus promoter (17) were precultured in minimal medium lacking leucine, transferred to YES complete medium, and grown for 4 h in the presence or absence of oxygen. The Western blot was probed with anti-Sre1 IgG polyclonal antibody and imaged by LI-COR Biosciences Odyssey CLx and is representative of five biological replicates. P and N denote Sre1 precursor and N-terminal forms. Asterisks indicate nonspecific bands. D, Western blot, probed by polyclonal anti-Sre2 and polyclonal anti-Cdc48 (for loading) and imaged by LI-COR Biosciences Odyssey CLx, of lysates treated with alkaline phosphatase for 1 h from WT, mga2Δ, dsc2Δ, or sre2Δ cells grown in the presence of oxygen. E, quantification from D of six biological replicates normalized for loading to Cdc48 and then normalized to WT N terminus band for comparison between blots. Error bars are 1 S.D. (**, p < 0.01 for N terminus by two-tailed Student's t test). Quantities of the precursor and nuclear form are stacked to give an approximation of total signal per treatment. Average percent cleavage (clvg.) is calculated by dividing the quantity of N terminus by the sum of both N terminus and precursor.

