
FIGURE 2.
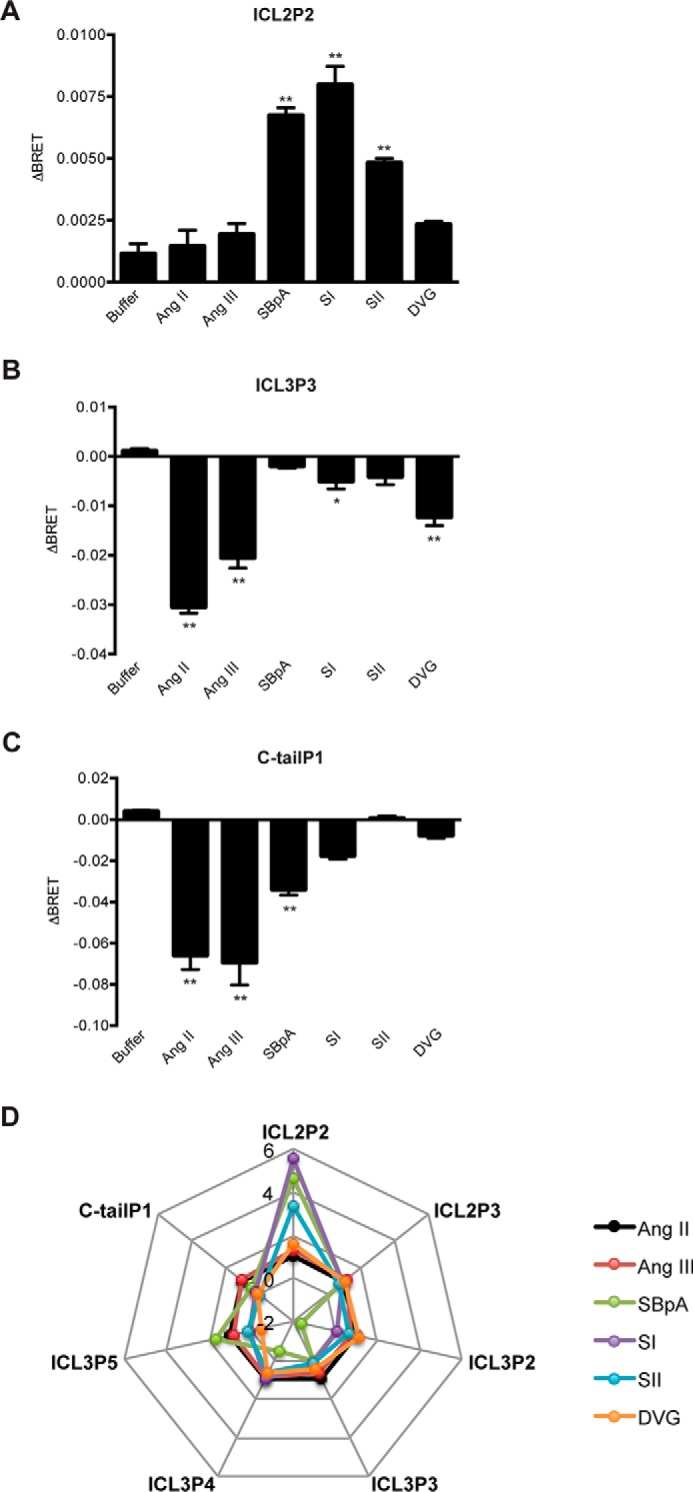
Agonist-induced BRET changes. The sensor panel was transiently expressed in HEK 293 cells, and FlAsH-labeled and agonist-induced BRET was measured and calculated as described under “Experimental Procedures”; ICL2P2 (A), ICL3P3 (B), and C-tailP1 (C). Bars, mean ± S.E. (error bars) of ΔBRET of 3–6 replicates from three independent experiments. Statistical analysis was performed as described under “Experimental Procedures.” *, p < 0.05; **, p < 0.01. D, radar plot representation to capture ligand bias using conformational profiling. Ligand responses (i.e. the agonist-induced BRET) shown above were normalized to those of Ang II, which was set to 1 for all biosensors tested.