
FIGURE 7.
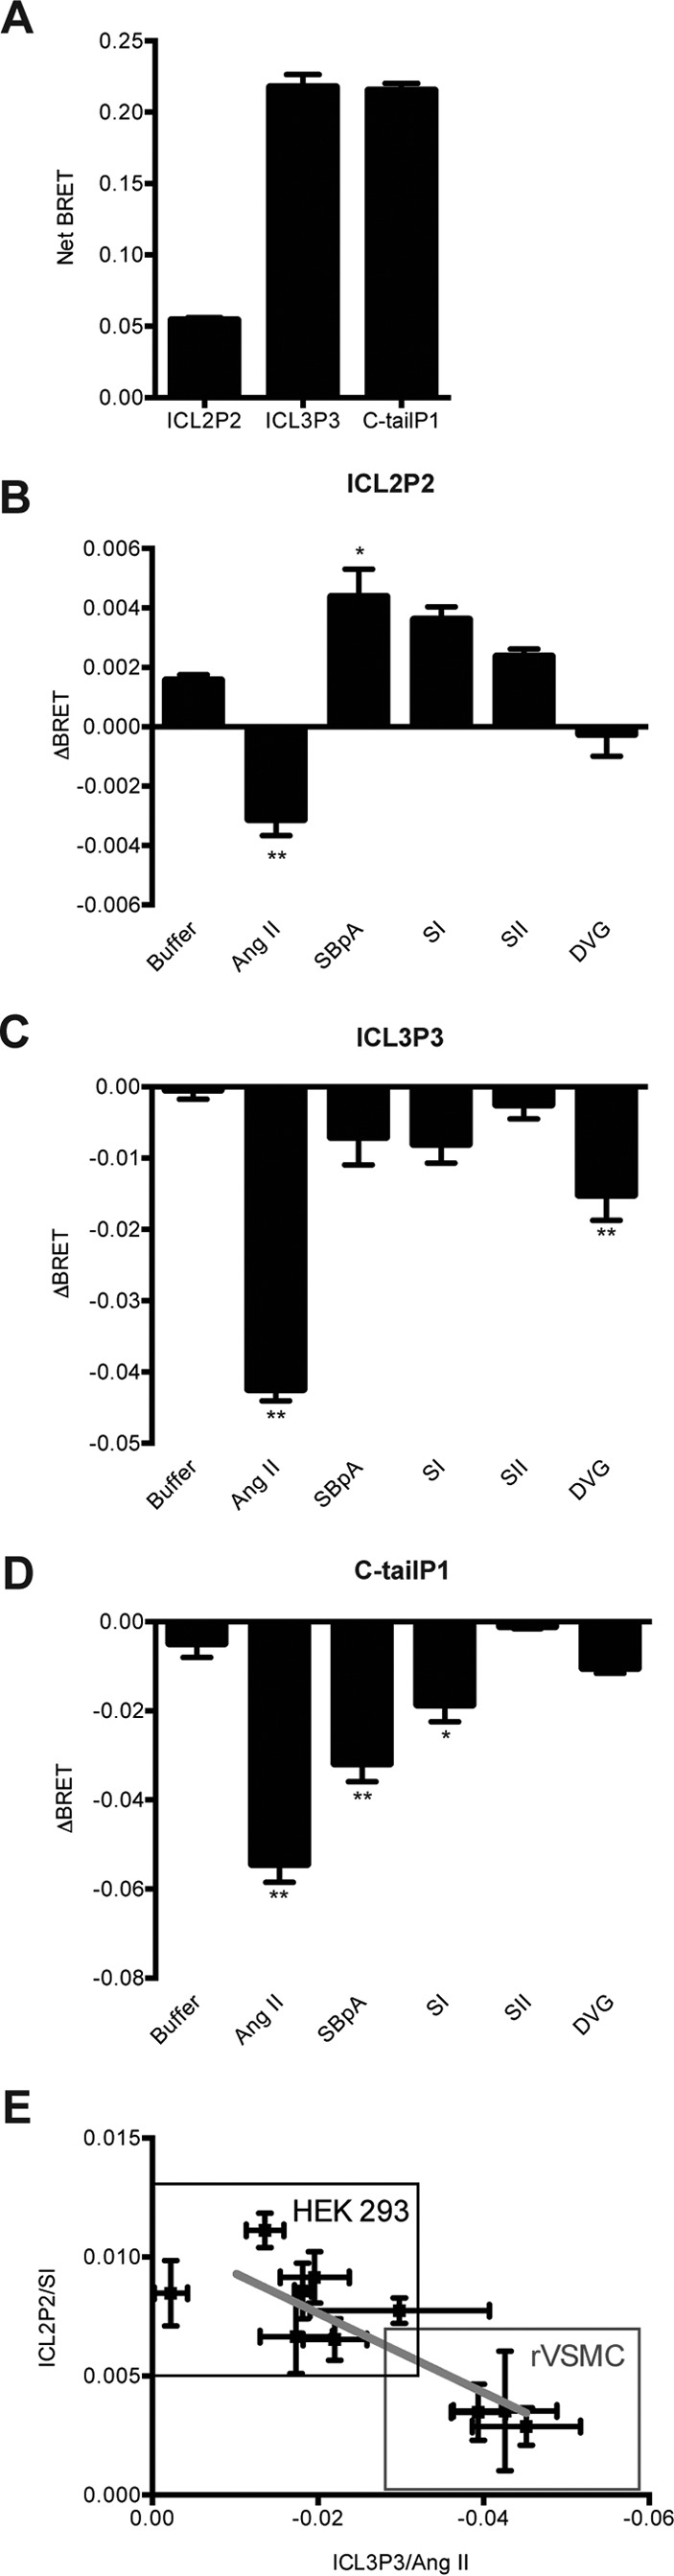
Monitoring conformational changes in AT1R in VSMCs. Shown are basal net BRET (A) and agonist-induced BRET changes (B) for the ICL2P2, ICL3P3 (C), and C-tailP1 (D) expressed in rat VSMCs; bars represent mean ± S.E. (error bars) of triplicate values from 3–5 independent experiments. For agonist, biosensors transiently expressed in rat VSMCs were measured and calculated as previously described. Statistical analysis for each analogue versus buffer treatment was performed as described under “Experimental Procedures.” *, p < 0.05; **, p < 0.01. E, correlation plot between responses in HEK 293 cells and VSMCs. Points represent ΔBRET values of SI-induced ICL2P2 and Ang II-induced ICL3P3 drawn from independent experiments done in both cell types. The plotted line shows linear regression for all experiments conducted (R2 = 0.7102, p < 0.05).