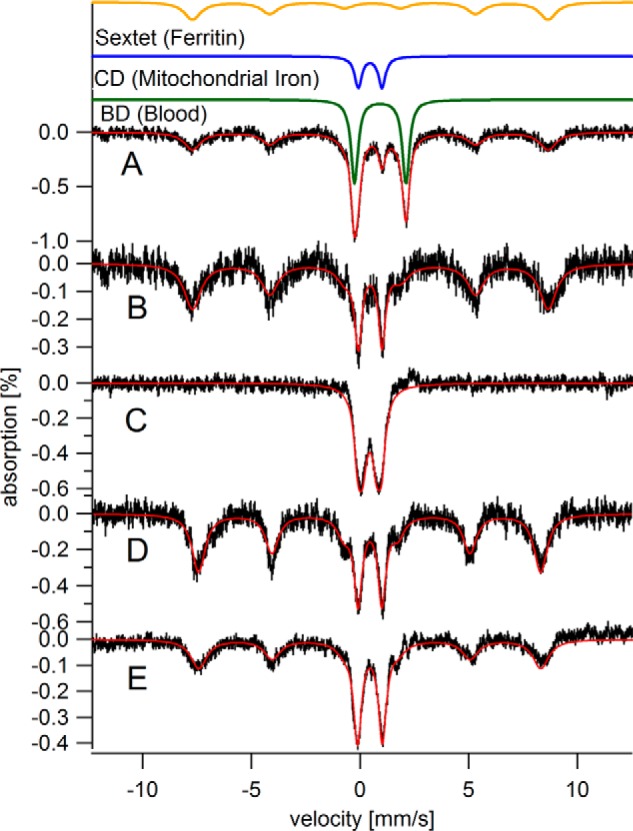
FIGURE 1.

Mössbauer spectra of hearts from elderly mice. All spectra presented in the text were collected at 5 K except for in C, which was collected at 100 K (and in Fig. 5D, which was collected at 70 K). In all MB spectra presented in the text, a 0.05 tesla magnetic field was applied parallel to the gamma rays. The solid red lines overlaying spectra in all MB figures are simulations using parameters listed in Table 1. A, C60, raw spectrum (all other spectra have the blood doublet removed). The solid green, blue, and gold lines above the data are simulations of the blood, CD, and ferritin components, respectively. B, C60 with contribution from blood removed; C, same as B but at 100 K; D, C52; E, I104.
