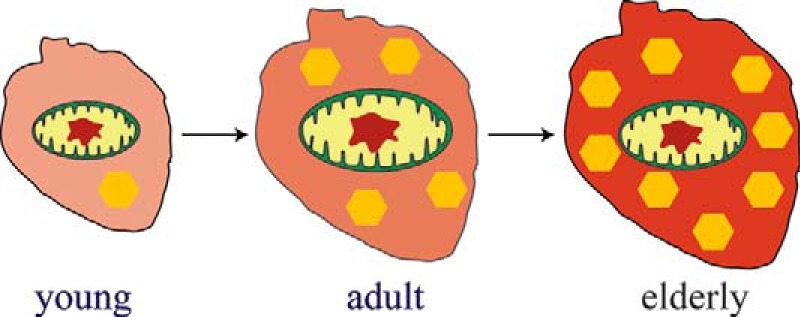
FIGURE 7.

Illustration of how iron content changes with age in healthy mouse hearts. The opacity of the background reflects the overall iron concentration in the heart. The size of the mitochondria reflects the concentration of iron present in that organelle. The number of yellow hexagons represents the concentration of iron present as ferritin.
