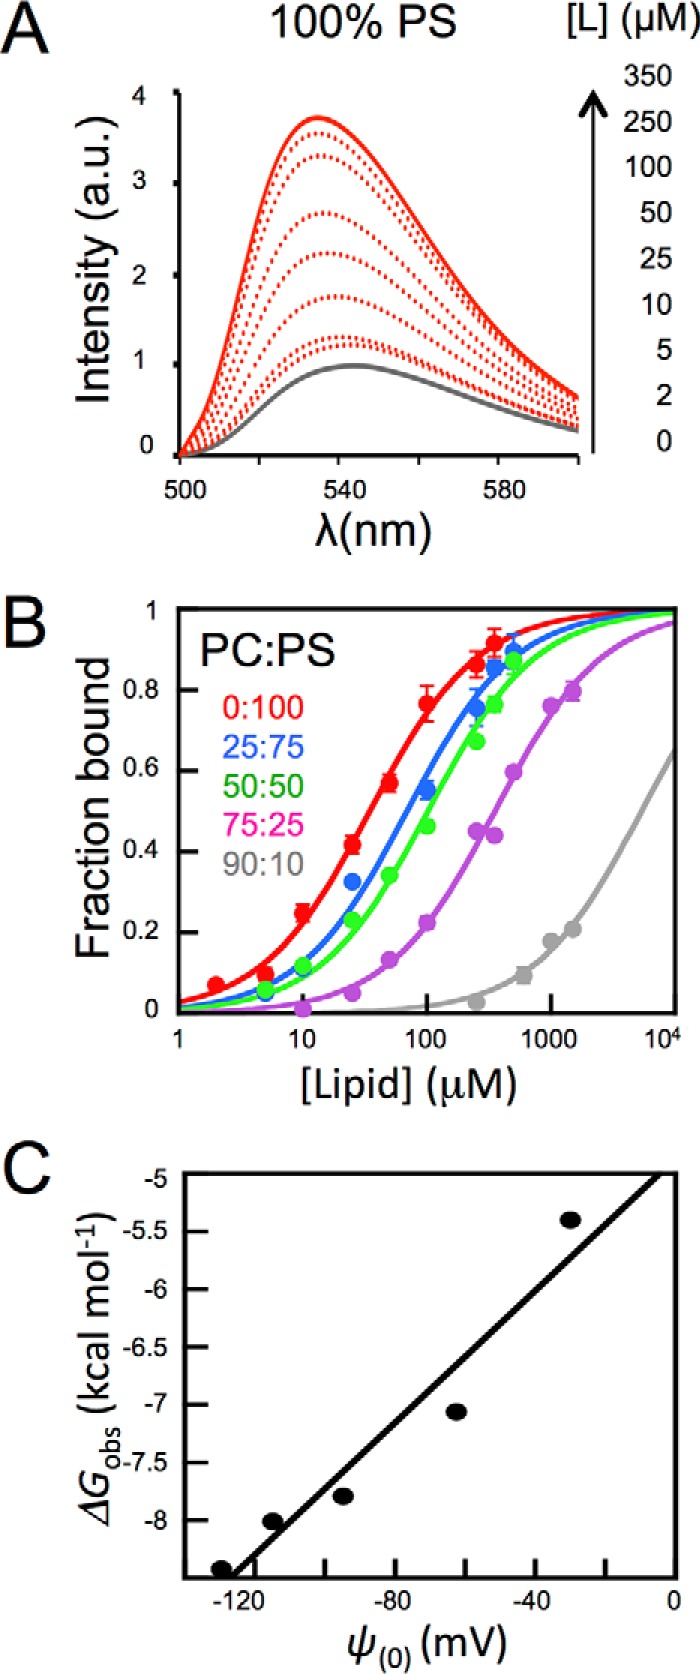
FIGURE 6.

Effect of anionic phospholipid density on 4E10 binding to LUVs. A, changes of NBD-4E10 fluorescence in the presence of increasing concentrations PS LUVs as indicated in the panel. B, titration of NBD-labeled Fab with vesicles containing different mol percentages of PC:PS as follows: 90:10 (gray), 75:25 (magenta), 50:50 (green), 25:75 (blue), and 0:100 (red). The molar fraction partition coefficients, Kx, were calculated from the best fit of Equation 1 to the data (curves). Each symbol on the plot represents the average (±S.D.) of three independent experiments as the one displayed in the previous panel. C, plot of the free energy of partitioning versus the membrane surface potential in the previous lipid vesicles, estimated according to Equations 2 and 3, respectively. Conditions otherwise as in Fig. 5.
