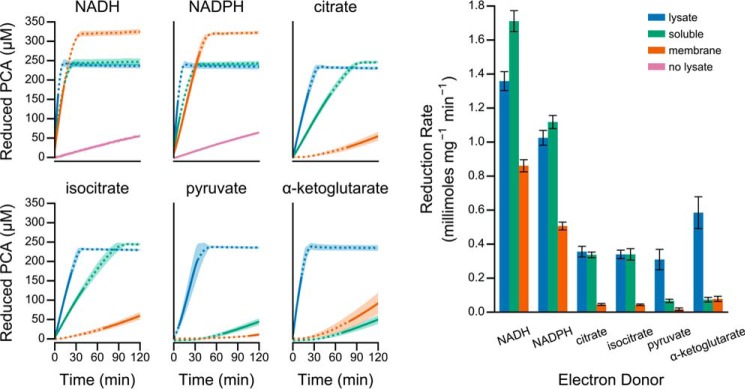
FIGURE 3.
Fractionation of PCA reductase activity in cell-free lysate. Cell-free lysate was fractionated into soluble- and membrane-associated components by ultracentrifugation. The fractions were assayed for their ability to catalyze PCA reduction. Left, each panel illustrates a time course of PCA reduction using the indicated electron donor. The line and shaded region represent the mean and standard deviation, respectively, from four independent assays using lysate prepared from independent cultures. The solid portion of each line indicates the linear region used for quantification. Right, specific activity for each fraction was determined by normalizing the rate of PCA reduction, illustrated with a solid line in the left panels, by the protein concentration of each fraction. Error bars represent the standard deviation from four independent biological replicates.

