FIGURE 7.
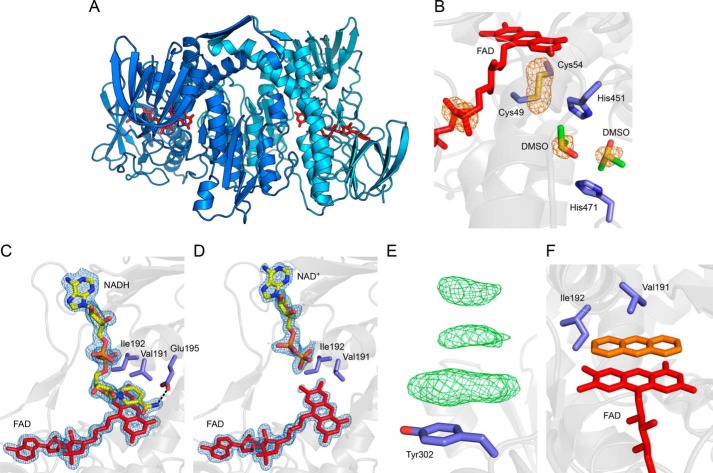
Structural analysis of LpdG. Where visible, the embedded FAD cofactor is shown in red. Protein side chain carbons are shown in purple. A, overview of the LpdG dimer. The two polypeptides of the biological assembly are shown in shades of blue. B, close-up of DMSO bound in the lipoamide binding pocket. The orange mesh represents the anomalous difference map contoured at 4σ, which highlights sulfur atoms and the phosphorus atoms in FAD. The DMSO carbon atoms are shown in green. C and D, close-up of NADH (C) and NAD+ (D) bound to LpdG. Electron density was not visible for the oxidized nicotinamide group in NAD+, and so this group has not been modeled. The blue mesh represents the 2mFo − DFc map of electron density for FAD and NAD(H) contoured at 1.5σ. The NAD(H) carbon atoms are shown in yellow. The dashed line illustrates a hydrogen bond interaction. E, example of π-stacking interactions at a surface residue in a crystal soaked with 225 mm PCA. The green mesh represents positive density in the 2mFo − DFc difference map contoured at 3σ. F, hypothetical illustration of a phenazine (orange) substituting for NADH, demonstrating a steric clash with Ile-192. The phenazine was placed manually in Coot and does not represent a real dataset.

