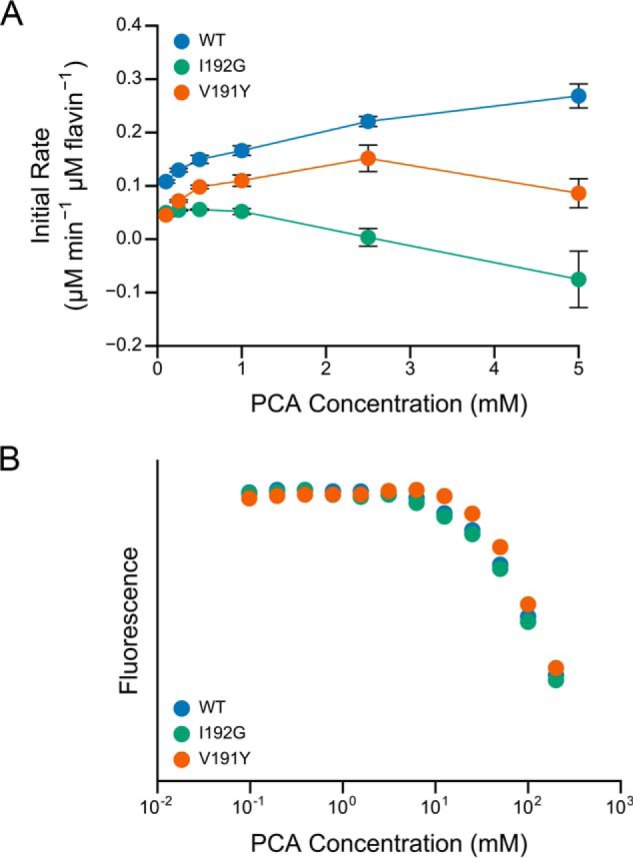
FIGURE 8.

Site-directed mutagenesis of LpdG. A, PCA reduction by site-directed mutants of LpdG. The initial rate of reduction was normalized by the concentration of protein (2 μm) and subtracted by the abiotic rate of reduction as measured without protein. Error bars represent the standard deviation of four technical replicates. B, affinity of site-directed mutants of LpdG for PCA as measured by fluorescence quenching. The fluorescence values are normalized to the maximum fluorescence for each mutant.
