Figure 5.
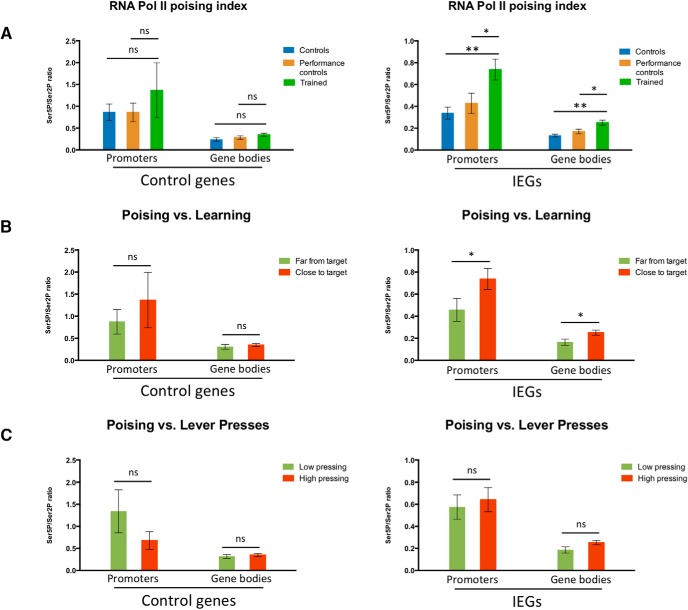
RPB1 CTD poising index at IEGs in the striatum and its correlation with learning of a fast lever-pressing task. ChIP-qPCR % of input data for pooled Ser5P/Ser2P RNA polymerase II RPB1 CTD ratios (poising indices) at the promoters and gene bodies of positive control targets (Gapdh and Tubb5) and IEGs (Arc and Fos) in the striatum of (A) control and performance control mice (performance control animals were killed after completion of FR8-50s, roughly corresponding to a halfway point in the training regime), as well as mice fully trained in the fast lever-pressing task (controls n = 4; performance controls n = 4; trained n = 3); (B) performance control and fully trained mice grouped as, respectively, far from target and close to target, according to the distance to target value (i.e., distance of all seven consecutive IPIs from the final covert target) each animal presented at completion of FR8-50s or FR8-1s schedules, with far from target animals displaying a distance to target value over 0.6 and close to target animals a distance to target value under 0.6; and (C) mice trained in the fast lever-pressing task grouped according to the number of lever presses performed in their final training session, with low pressing animals finishing with under 250 lever presses and high pressing animals with over 250 lever presses. Data as mean ± SEM; *p < 0.05; **p < 0.01; n.s., p > 0.05.

