
Fig. 6.
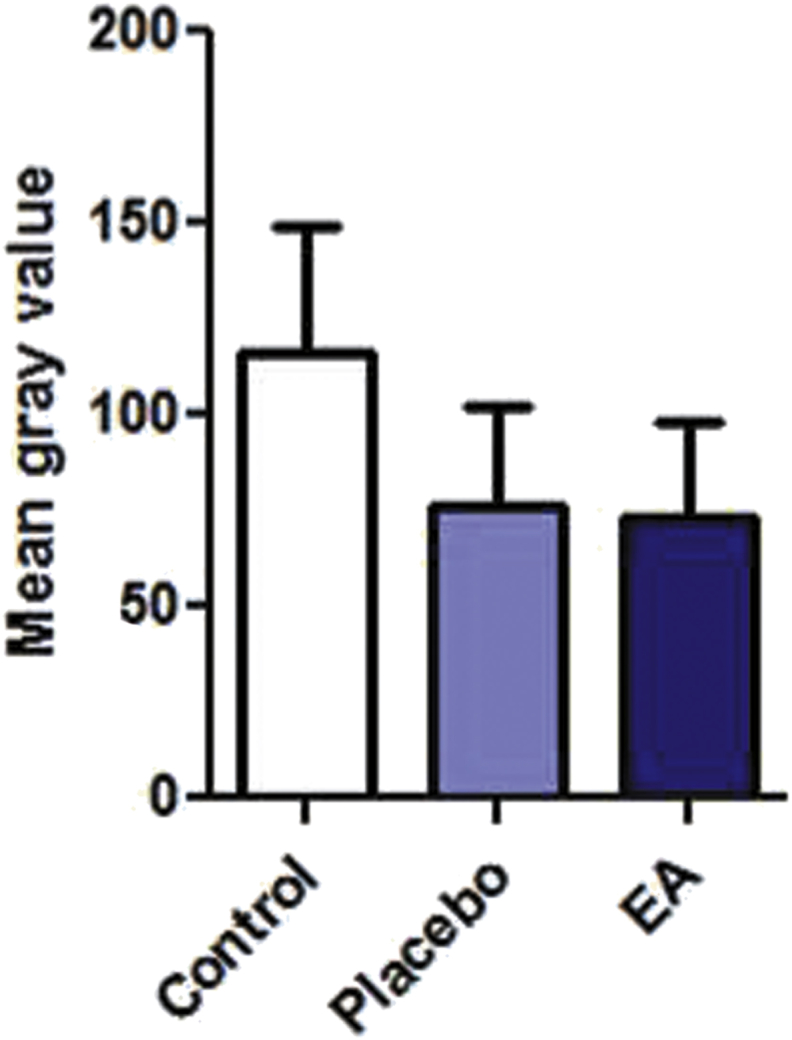
Image analysis for the degree of fibrosis of burn ulcers. The analysis was performed using ImageJ software. Color deconvolution plug-in was used to separate the blue color. After that at least 150 points were randomly selected on the deconvoluted blue image, and the mean gray value was measured for the blue color using the measure function in ImageJ software. The paired-sample t-test showed no statistically significant difference between the mean gray values for EA-treated samples and the placebo.