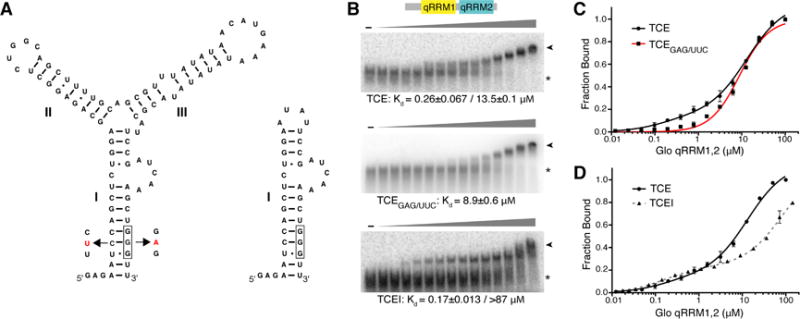
Figure 3. Glo recognizes two elements in the nos TCE that contribute higher and lower affinity components.

(A) Predicted secondary structures of TCE and TCEI RNAs. RNA secondary structure prediction was calculated using Mfold (Zuker, 2003). TCEI, II, and III elements are indicated. The complete sequences of the transcribed RNAs are shown. The G-tract in TCEI is boxed and TCEGAG/UUC mutations are indicated in red. (B) Representative EMSA gels of purified recombinant Glo qRRM1,2 binding to TCE (top), TCEGAG/UUC (middle), or TCEI (bottom) RNAs. The highest Glo qRRM1,2 protein concentration (right-most lanes) was 100 μM for the TCE and TCEGAG/UUC binding assays and 144 μM for the TCEI binding assays with 2-fold serial dilutions. No protein was added to the reactions in the lanes marked ‘-’. The positions of unbound RNA (asterisk) and Glo qRRM1,2:RNA complex (arrowhead) RNA are indicated. (C) Superposition of plots for binding of Glo qRRM1,2 to TCE (red) or TCEGAG/UUC (black) RNA. Higher affinity binding to the TCE is selectively disrupted by mutation of the G-tract sequence in the TCEI stem. Three technical replicates of EMSAs were performed, and apparent Kd values shown are mean ± SEM. (D) Superposition of plots for binding of Glo qRRM1,2 to TCE (red) or TCEI (dotted black) RNA. The TCEI stem alone retains the higher affinity binding component of the Glo-TCE interaction, but the lower affinity component is diminished. See also Figure S1.
