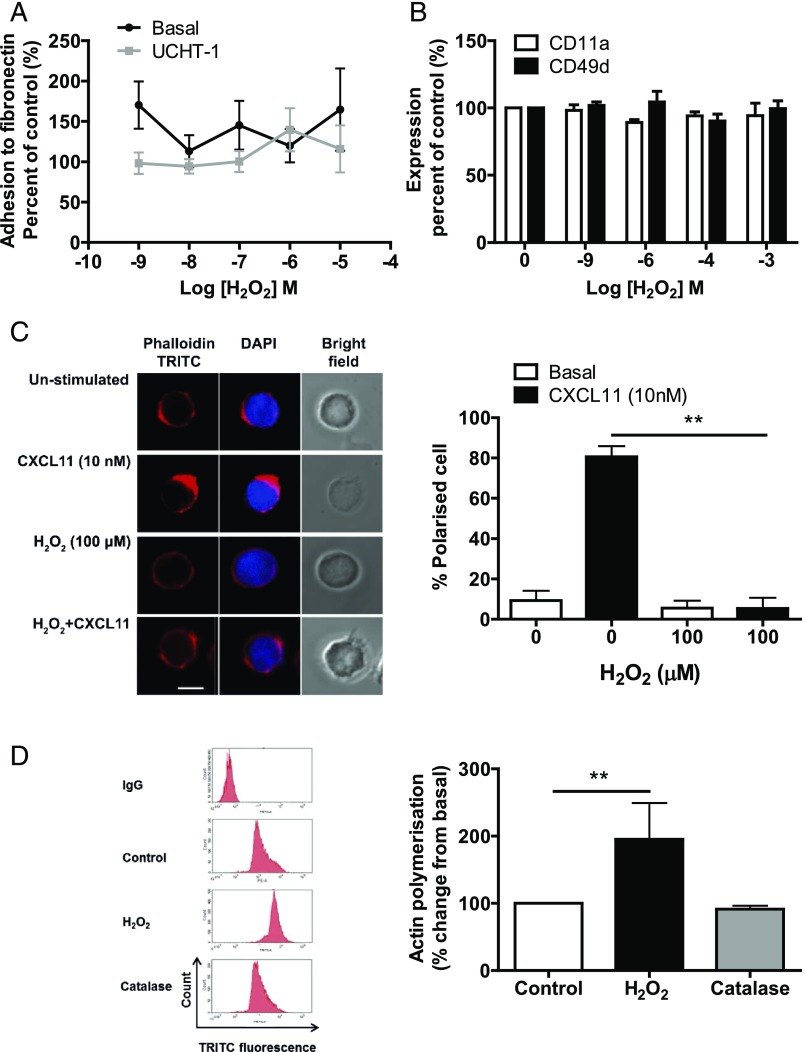
FIGURE 2.
Effect of H2O2 and CXCL11 on polarization of SEB-activated T lymphocytes. (A) SEB-activated T lymphocytes (1 × 10⁶) were pretreated with increasing concentrations of H2O2 for 30 min. Cells were stimulated with UCHT1 (10 μg/ml) for 5 min, before being allowed to adhere to fibronectin (10 μg/ml)-coated 96-well plates for 30 min. The plate was sealed and turned upside down for 15 min. Wells were washed gently with PBS to remove any unadhered cells. Cells were then scraped and counted using flow cytometry. Graph shows percentage change from basal. (B) Cells were treated with increasing concentrations of H2O2 for 30 min and then the expression of CD11a and CD49d was assessed using PE-conjugated Abs and analyzed by flow cytometry. Data are represented as percentage change from basal and mean ± SEM of three independent experiments. (C) SEB-activated T lymphocytes (1 × 10⁶; 8–12 d after isolation) were pretreated with 100 μM H2O2 for 30 min and then stimulated with 10 nM CXCL11 for 5 min. Then, cells were fixed in BD fixation reagent, permeabilized with BD permeabilization reagent, and stained with TRITC-tagged phalloidin and DAPI. The left panel shows immunofluorescence microscopy representative images showing actin and DAPI staining. Scale bar, 10 μm. The right panel represents the mean ± SEM percentage of polarized cells observed from three independent donors, with 20 cells counted for each condition. Statistical significance was determined by two-way ANOVA with a Bonferroni posttest. **p < 0.01 compared with control. (D) H2O2, but not catalase, increases actin polymerization of SEB-activated T lymphocytes. One million SEB-activated T lymphocytes (8–12 d after isolation) were washed three times in serum-free medium and treated with H2O2 (100 μM) or catalase (1 mg/ml) for 30 min. Cells were fixed using BD fixation reagent for 20 min, permeabilized, and incubated with TRITC-tagged phalloidin for 30 min. Mean fluorescence intensity per 10,000 cells was measured using flow cytometry. Data are (left panel) representative FAC plots from one donor and (right panel) mean ± SEM minus IgG control, normalized to the untreated control from three independent donors. Statistical significance was determined by a one-way ANOVA with a Dunnett posttest. **p < 0.01 compared with control.

