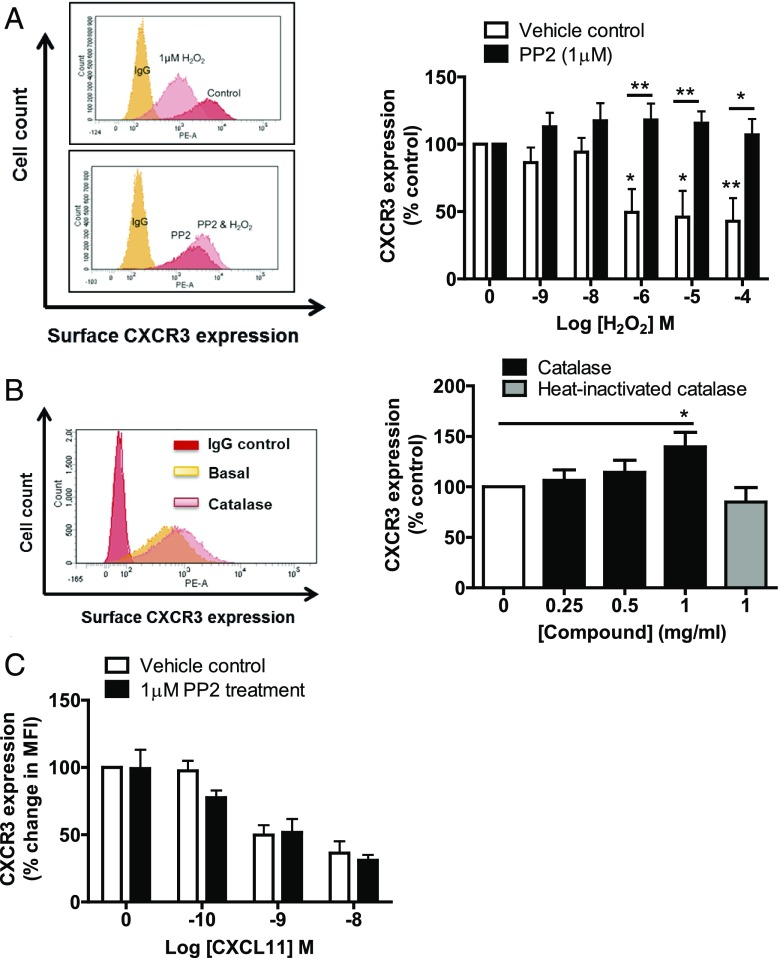
FIGURE 3.
Exogenous H2O2 requires Src kinase to reduce surface expression of CXCR3. (A) The left panel shows representative FACS plots from a single donor showing the effect of H2O2 on CXCR3 expression in SEB-activated T lymphocytes with or without PP2 (1 μM) treatment. The right panel shows the mean ± SEM of three independent donors, normalized to the untreated control. Statistical significance was determined by a two-way ANOVA with a Bonferroni posttest. *p < 0.05, **p < 0.01. (B) The left panel shows a representative FACS plot for a single donor showing the effect of catalase on CXCR3 expression. The right panel shows the mean ± SEM of three independent donors, normalized to the untreated control. Statistical significance was determined by a one-way ANOVA with a Dunnett posttest. *p < 0.05, as compared with control. (C) Graph showing effect of increasing concentrations of CXCL11 on CXCR3 expression in SEB-activated T lymphocytes pretreated with Src kinase inhibitor PP2 (1 μM). Level of surface CXCR3 expression was determined using PE-conjugated CXCR3 Ab. Data are mean values ± SEM of three independent experiments.

