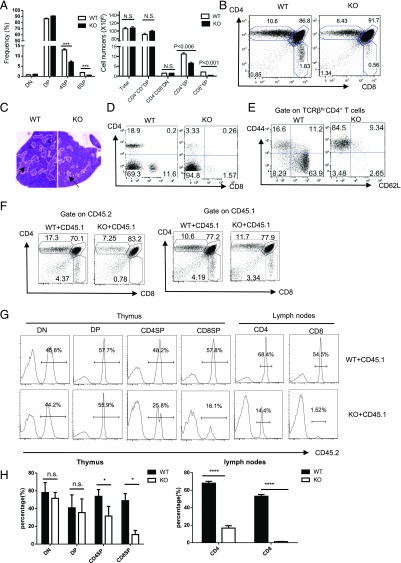
FIGURE 2.
Ubc9 deficiency impairs thymic and peripheral T cell development. (A and B) Percentages and absolute cell numbers (A) and representative dot plots (B) of CD4+ SP, CD8+ SP, CD4+ CD8+ DP, and CD4− CD8− DN subset in 4- to 6-wk-old mice (WT, Ubc9fl/+Cd4Cre, n = 5; KO, Ubc9fl/fl Cd4Cre, n = 4). (C) H&E staining of thymus section from Ubc9fl/fl (WT) and Ubc9fl/fl Cd4Cre (KO) mice. The cortex (dark zone) and medulla region (light zone, indicated by arrow) can be distinguished by the intensity of staining (original magnification ×10). (D and E) Phenotype of peripheral T cells in Ubc9fl/fl (WT) and Ubc9fl/fl Cd4Cre (KO) mice. Representative CD4 and CD8 staining on TCRβhi splenocytes (D), and CD62L and CD44 staining on TCRβhi CD4+ (E) are shown (WT, Ubc9fl/fl, n = 3; KO, Ubc9fl/fl Cd4Cre, n = 3). (F) Flow cytometry analysis of CD4 and CD8 thymocytes by gating on tester (CD45.2+, left) or competitor compartments (CD45.1+, right) in Rag1−/− recipient mice. Numbers adjacent to dot plots indicate the percentage of each subset among total thymocytes (WT, Ubc9fl/fl, n = 3; KO, Ubc9fl/fl Cd4Cre, n = 3). (G and H) Contribution of tester bone marrow–derived progeny (CD45.2+) to T cell compartments in mixed bone marrow chimeric animals. Thymocytes and lymph node cells from bone marrow chimera were stained with anti-CD4, -CD8, and -CD45.2 (G). Numbers in histograms indicate percentages of CD45.2+ cells in each T cell subset shown on top of histograms; statistic results are shown in (H) (WT, Ubc9fl/fl, n = 3; KO, Ubc9fl/fl Cd4Cre, n = 3). Asterisks denote statistical significance compared with the indicated controls: *p < 0.05, ***p < 0.001, ****p < 0.0001.

