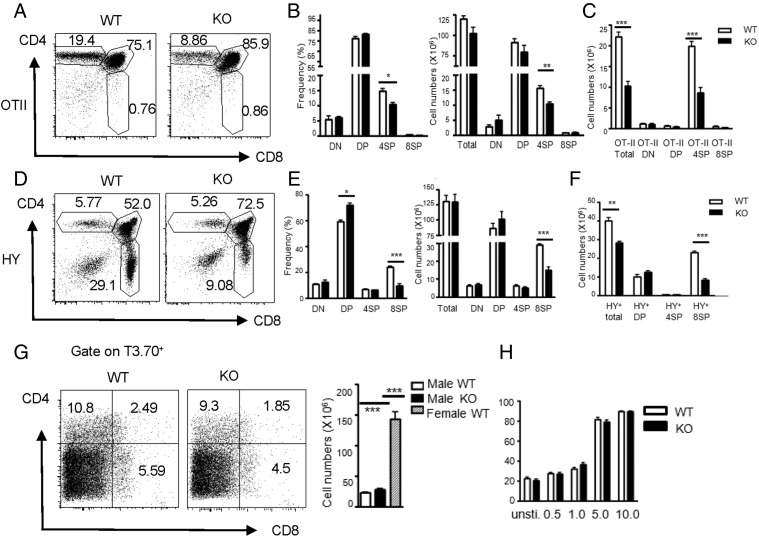
FIGURE 3.
Positive selection was disturbed in Ubc9-deficient thymocytes. (A–C) Surface staining of CD4 and CD8 on total thymocytes was shown as dot plots. Frequencies and total cell numbers of DN, DP, CD4 SP, and CD8 SP subset (B) or total cell numbers of Va2+ subset (C) were calculated and statistically presented as bar graphs (WT, Ubc9fl/fl OT-II+, n = 8; KO, Ubc9fl/fl Cd4Cre OT-II+, n = 5). (D–F) Surface staining of CD4 and CD8 on total thymocytes from female mice is shown as dot plots (D). Frequencies and total cell numbers of DN, DP, CD4 SP, and CD8 SP subsets (E) or total cell numbers of various T3.70+ subsets (F) were calculated and statistically presented as bar graphs (WT, Ubc9fl/fl HY+, n = 5; KO, Ubc9fl/fl Cd4Cre HY+, n = 4). (G) Surface staining of CD4 and CD8 on T3.70hi population from male Ubc9fl/fl HY+ (WT) or Ubc9fl/fl Cd4-Cre+ HY+ mice (KO) were shown as dot plots (left) (WT, n = 4; KO, n = 3). Total thymic cellularity of these male HY transgenic mice was calculated and statistically presented as a bar graph. Thymic cellularity from female Ubc9fl/fl HY+ (WT) mice included as a control (right). (H) Apoptosis of thymocytes from female Ubc9fl/fl (WT) or Ubc9fl/fl Cd4Cre mice (KO) mice in response to anti-CD3 (1×)/anti-CD28 (5×) stimulation for 24 h in vitro was assessed by Annexin V staining. Concentration of anti-CD3 (μg/ml) is shown on x-axis. The data are representative of at least two (A–G) or three (H) experiments. Asterisks denote statistical significance compared with the indicated controls: *p < 0.05, **p < 0.01, ***p < 0.001.

