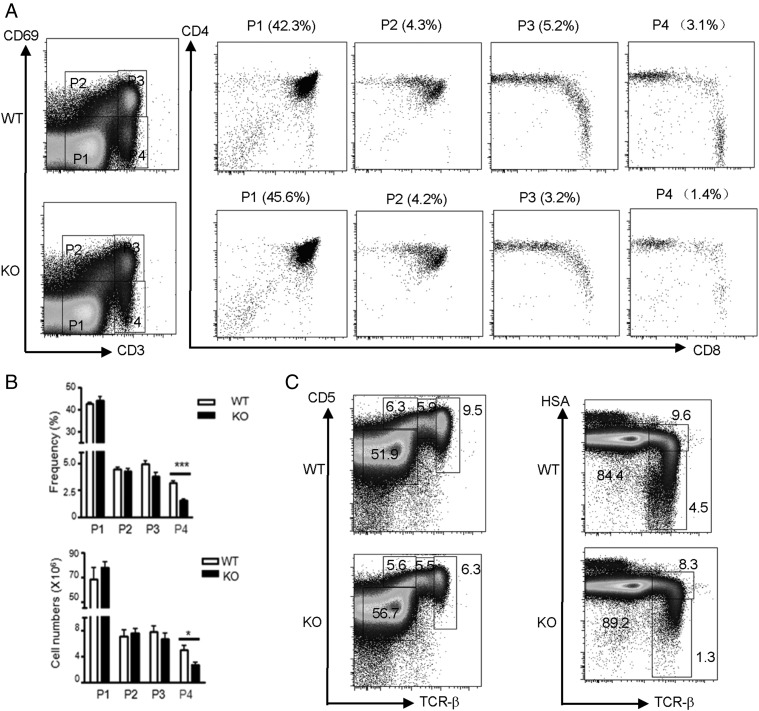
FIGURE 4.
Impaired late-stage development of thymocytes in the absence of Ubc9. (A) Flow cytometry analysis of CD3 and CD69 on total live thymocytes from Ubc9fl/fl (WT) or Ubc9fl/fl Cd4Cre (KO) mice was used to define sequential developmental stages (P1–P4) of T cells in dot plots. Numbers in parentheses above plots indicate percentages of each developmentally defined subpopulation among total thymocytes. (B) Bar graph shows statistical analysis of frequencies and absolute numbers of these developmentally defined subpopulations in (A) (WT, n = 4; KO, n = 3). (C) Flow cytometry analysis of TCRβ versus CD5 (left dot plots) and TCRβ versus HSA (right dot plots) on total live thymocytes from Ubc9fl/fl (WT) or Ubc9fl/fl Cd4Cre (KO) mice. Numbers adjacent to dot plots indicate percentage of each developmentally defined subpopulation in total thymocytes (WT, n = 5; KO, n = 7). The data shown are representative of at least five experiments. Asterisks denote statistical significance compared with the indicated controls: *p < 0.05, ***p < 0.001.

